FB Exposes Records

$FB has supposedly exposed some records. If history repeats itself we can bet on panic buying to set in and history does repeat itself. $FB opened flat and then took off premarket and didn’t look back.

To take advantage of the situation we’re going to sell a put vertical. We were only able to get filled near the close of market due to the up move but we’re in.

SELL -1 VERTICAL FB 100 17 MAY 19 165/160 PUT @1.14 LMT

We have a GTC in for 25% and plan to be out before expiration.

No time to #BTFD so just #BTFS

Marriott Bounces Back After Breach

Marriott suffered a huge data breach according to some reports. As we can see it scared the bulls to death. The stock reverted 2 standard deviations back to the mean and then dropped another 2 standard deviations. Like most events of this type we can expect this to blow over. We can see that it bounced hard off the lower Bollinger Band. This also gives us a sign that the long term damage is not being seen by the markets. January 18 options are about 50 days away which gives the stock more than enough time to bounce back. After entering this trade we set a GTC order to close at 25% of max profit. Overall we managed to pull out  a 12.6% return on invested capital (margin of $332) the next trading day after entering. The size of this bounce was surprising as Marriott bounced back above the mean in almost no time. The stock was on an upward trajectory prior to the news and the overall market has turned bullish. Most likely it will continue upward to the upper Bollinger Band.

Opening Trade

Sold 1 MAR 01/18/19 Put 115.00 @ 4.20
Filled at: Nov 30, 2018 10:13:06 AM EST

Bought 1 MAR 01/18/19 Put 110.00 @ 2.50
Filled at: Nov 30, 2018 10:13:06 AM EST

 Credit 1.70

Closing Trade

Bought 1 MAR 01/18/19 Put 115.00 @ 2.77
Filled at: Dec 3, 2018 10:10:17 AM EST

Sold 1 MAR 01/18/19 Put 110.00 @ 1.49
Filled at: Dec 3, 2018 10:10:17 AM EST

Debit 1.28

Following The Anthem Hack In The Market

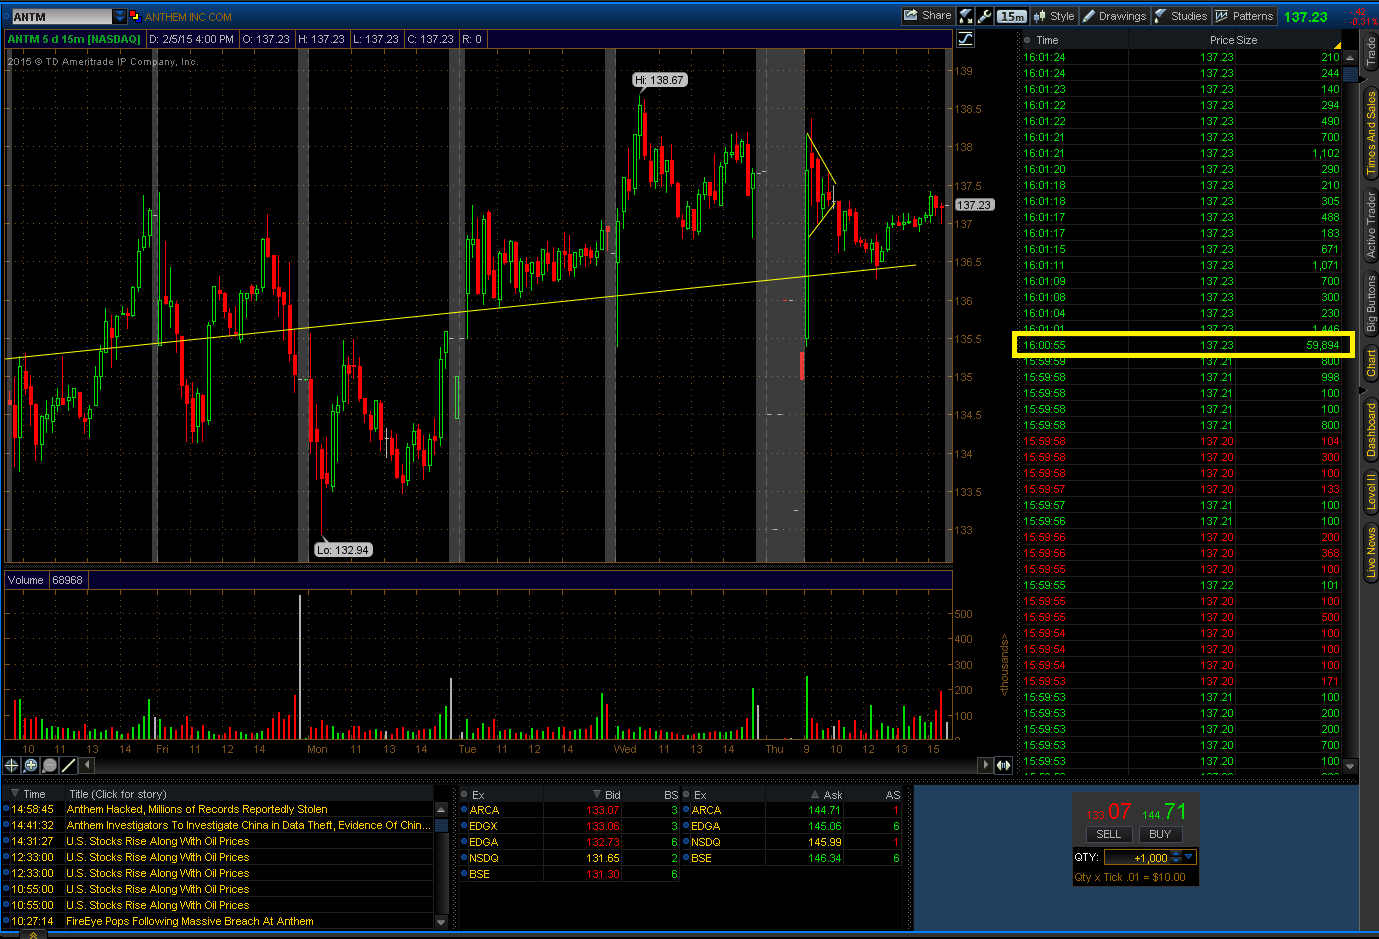
The next company that is allegedly going out of business from hackers has been discovered. $ANTM supposedly had around 80M records taken. If only they were filming a movie about North Korea at the same time. We can see that amid all the panic that the professionals were moving into the stock.

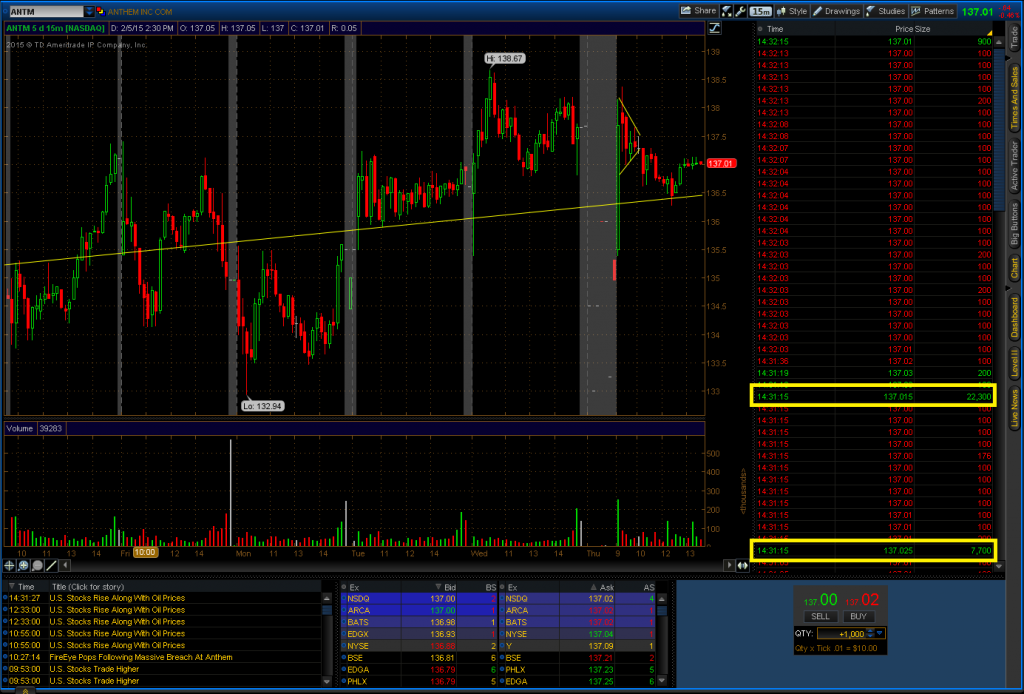
The first observation is that the stock hits a high for the week on the news and stays above the current upward trend. The next day it rockets straight up at market open. Lets also take a look at Time & Sales on the right side of the screen. Lots of red means than there are sellers. But buried among the haystack are two interesting needles. Someone bought 30,000 shares of $ANTM. You’re not going to plow $4,110,527 into a stock that is going out of business. But wait! There’s more!

2015-02-05b-ANTM-TOS-CHARTS

At market close someone bought 59,894 shares. You’re not going to plow $8,219,253.62 into a stock that is going out of business. Anytime you see a big buyer move in you know there’s some confidence in the underlying.2015-02-05c-ANTM-TOS-CHARTS


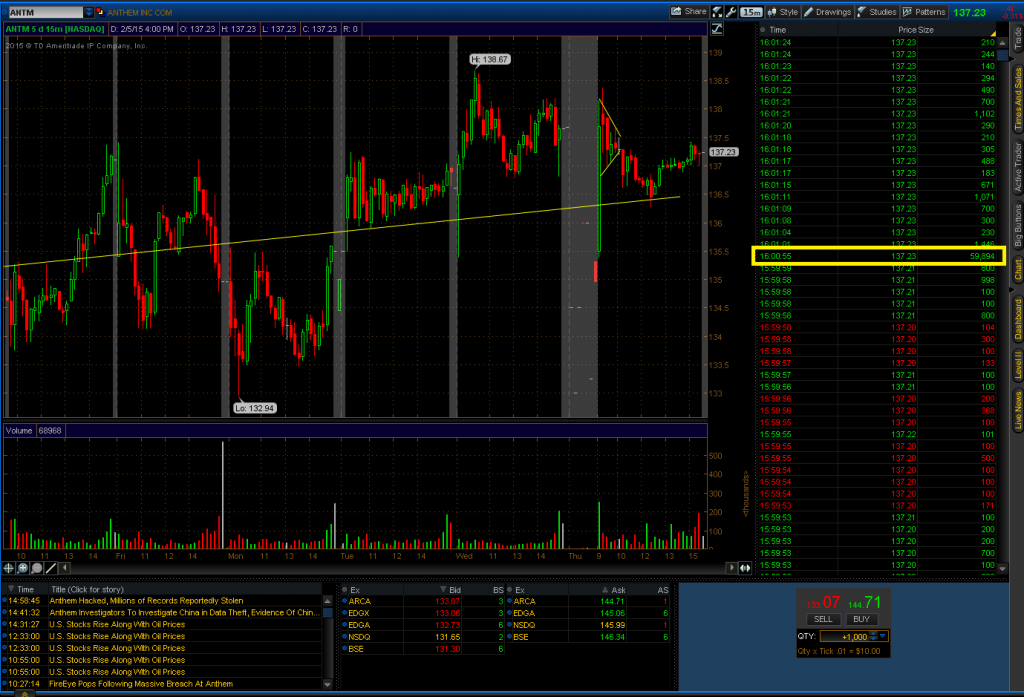
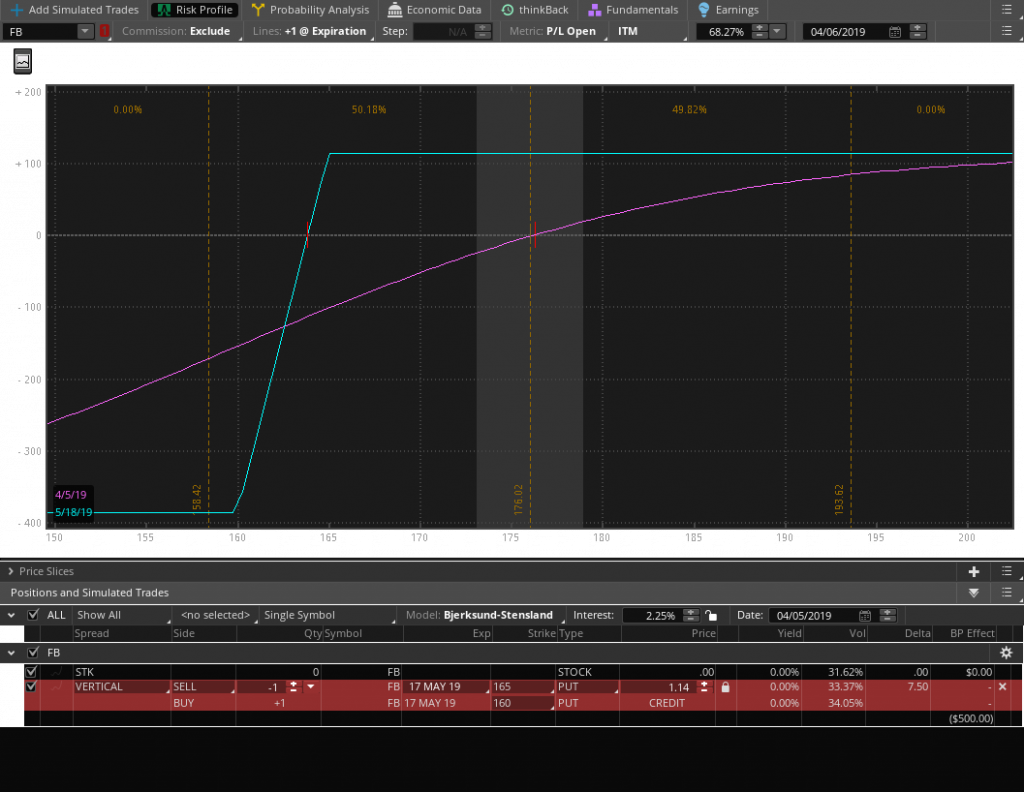
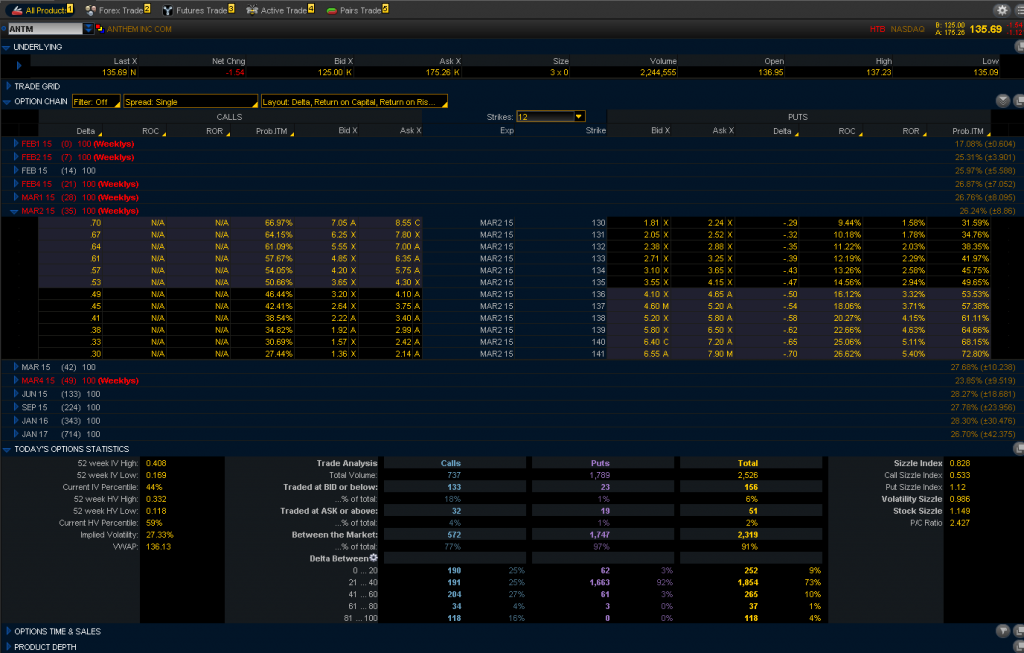
We can see that the options market is hot on the news. IV is around 27%, which is relatively low. The IV Percentile is around 44% which isn’t high enough to warrant shorting volatility. You would want to see that number above 50% to make it worth your while. When we look at the Puts there is a 31.59% chance that the stock will be below $130 at options expiration 35 days from now.

2015-02-07-StockAndOptionQuoteForANTM


All signs are pointing to calculated buying and minor impact, unless the cold weather returns.

BTU Short Call Vertical

Today a fellow trader suggested a fundamental reason for getting bullish on BTU after the next pull back.  Since there’s an expectation for a pull back then we need to take a look at this.


BTU has been in a down channel since February.  Something may change eventually, but until it breaks out of the channel it’s still in a long term down trend.  Two days ago it touched the trend line with a long legged doji pattern.  The next day it closed below the doji and the previous day’s open.  A reversal may be starting.

The MACD has started to roll over, Stochastic, and RSI are also pointing down.  PPS is also giving a sell signal.  There are only 11 days left in July  so that may be taking on too much Gamma.   The Implied Volatility is 61% in August which is close enough to July.  Today we decided to go with a short call vertical with the short strike around 30 delta.  The Aug 26/27 spread looks the most interesting.  We managed to get a fill at .32 per spread just below the highs of the day.  Today the spread closed up 6% from BTU dropping over 1.00.

XRT Unbalanced Butterfly

XRT is the Retail sector ETF and has been as low as 56 after failing a double top breakout at 63.

It could be possible to sell a call spread against XRT, but there’s another strategy that can be tried.  Instead of a regular Butterfly we can look into the 61-62-64 broken wing butterfly for a 0.15 Credit.

This has some interesting properties.  The P/L graph in red is for August expiration on 8/18.  Notice that if the underlying ETF goes below 61 it’s still above the zero line meaning it’s possible to make money no matter how low it goes.  Between 61 and 63 the P/L turns into a pyramid and then drops off sharply after 63.  This is a strategy that one would want to use if you are confident the underlying will not go above the outer wing of the Butterfly.  You’re hoping for it to stay stuck in the sweet spot between 61 and 63, as close to 62 as possible by 8/18, but if it drops off from here, there’s no risk to the downside.

FB Strangle Trade

This is another example of using small sized strangles as an income strategy.  This is an Aug 27/39 Strangle in $FB.  The trade was opened on 6/27 for a .95 and .70 credit on the two strikes.  Implied Volitility for August was at 62%.  These two strikes were selected at the 20 Delta level.  The area on the risk graph is very wide giving a good chance for being successful.  One week after putting the trade on there’s approximately a 30.30% gain due to Theta and a 5% reduction in volatility.


QQQ Strangle Trade

This is a farther dated option strategy than most but the option volatility is good here. First let’s look at an Iron Condor near 30 Deltas.  Our max profit is 41 which is good for a 30 Delta. 


2012-05-24-QQQ-IC-Analyze


The Strangle provides 1.61 Credit per spread, compared to the .41 per spread for the Iron Condor.  This position is Theta positive, but the decay will not affect the position that much for a few weeks.  The Strangle provides us with a wide area to profit in.  The margin requirement will be higher since these are uncovered options.  The advantage is that it takes fewer Strangle give a good credit when compared to the Iron Condor.  The P&L curve is also more forgiving as the edges are approached.

2012-05-24-QQQ-Analyze


This position will benefit over time, but a reduction in volatility will produce results even faster.  If Volatility drops by 5% we can see from the simulation that almost 50% of the max gain can be realized if the price remains close to where it is today.  Since the position is slightly Delta positive there can also be a little upside before the gains begin to drop off.  If the position moves too much then it is possible to roll both strikes to cover the new range.  The Strangle can be an effective alternative to the Iron Condor if your trading size is reduced and if you have the margin available.


2012-05-24-QQQ-Vol-Analyze

Market Review 05-05-17 IWM


IWM has fallen below the neck line of a head & shoulders pattern.  We took action on May 4 to hedge risk by moving into a 76 Put Calendar after seeing the beginning of a H&S pattern.  The 20MA was under the 50MA which lead us to believe there would be continued weakness. 


This position benefitted from the increase in volatility (RVX) over the past few days.   We traded through the max profit point one day before expiration which meant the position worked perfectly.  The measured move from the head to the neckline places IWM around the 71 level.  There is also some prior support close to there.  There could be a small bounce at the 200MA, but if news out of Europe continues to be uncertain this could end up being a textbook H&S pattern. 

2012-05-17-IWM-PROPHET


If there is a continued downside move, buying more PUT calendars here could be a good choice.  Buying a June PUT and selling a May Weekly PUT against it could offer several opportunities to roll the calendar or switch it to a diagonal.  A double calendar gives a large area to salvage the trade in a one week period, but it reduces the reward.

2012-05-17-IWM-Analyze


A different strategy would be to sell a 30 Delta PUT Vertical around 72 in anticipation of a bounce.  They are currently going for .24, but putting in a limit order to ask for more premium might be in order, especially if there is more downside.  .36 would be at roughly 73

2012-05-17-IWM-2-Analyze

HPQ Trade

2012-03-05-HPQ-PROPHET


Hewlett Packard may be putting in a bottom here.  There are several bounces above the 25 level in late November and through December.  The Market Forecast indicator is also showing a crossover.  This may be a good area to deploy a APR 25/24 Bull Put spread.  After hours quote is currently at .36.  Anywhere from .30-.45 should be a good entry point.

JCOM Entry & Exit


A few days ago the Persons Proprietary Signal displayed a buy on JCOM after bouncing off the lower Linear Reg Channel.  MACD and Stochastics were also showing a bullish crossover.  We entered at 28.23 and trailed up our stops daily.  We were stopped out at 28.89 at market open and did not reopen the position due to earnings.  It may have been better to close the position near the top of the Linear Reg Channel in hindsight with all of the activity from Greece affecting the market. 

2012-02-17-JCOM-TOS_CHARTS