EURUSD FXE Trade


Unless you’ve been hiding under a rock you know that the PIIGS nations are really hammering Europe.  We keep hearing about the collapse of the US Dollar, but is the Euro in more trouble than the dollar?  Now that QE2 is off the table that might be changing.  The S&P 500 has had a hard time breaking above its recent channel and has been going sideways for a few days now.  How can we take advantage of the situation?

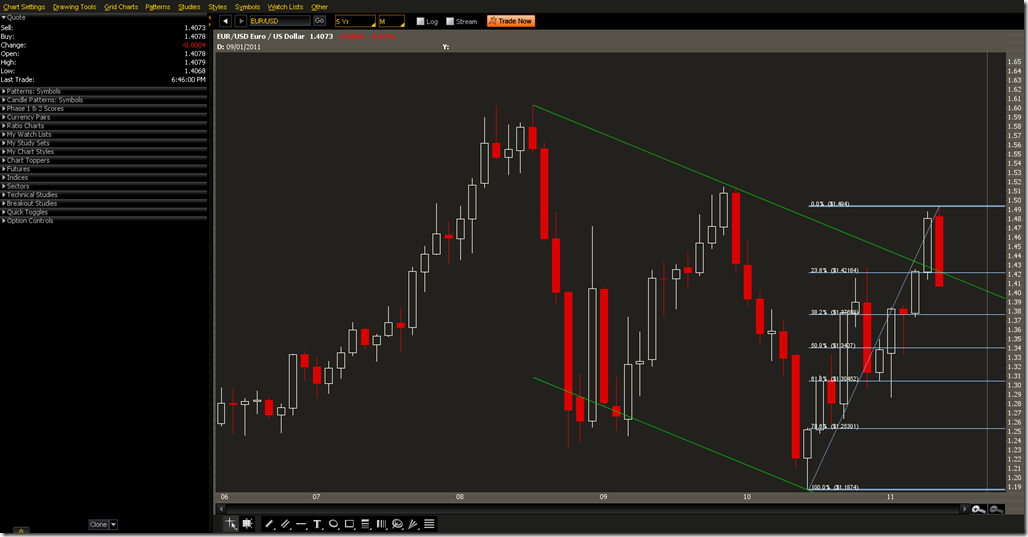
A monthly chart will let us visualize what is happening here.  Last month EUR/USD made it above the down channel, but it returned back to the channel this month.  There are several interesting things happening here. The channel intersects with the 23.6% Fibonacci level this month and the underlying broke down.  This month’s candle is also a bearish engulfing candle. On a weekly chart EUR/USD topped out on 4/24, then formed a bearish engulfing candle the following week and has a confirmation candle the week after.  Last week’s candle was also the first weekly close inside the trend line and below the 23.6% Fibonacci level.

Shorting EUR/USD around 1.4150 with a 100-150 pip stop to begin with would be a good entry strategy.  The target price to cover would be close to 1.3800 at the next Fibonacci level.  This trade is worth $350 per contract with 100-150 worth of risk depending on where the stop order is placed.


2011-05-14-FXE-PROPHET

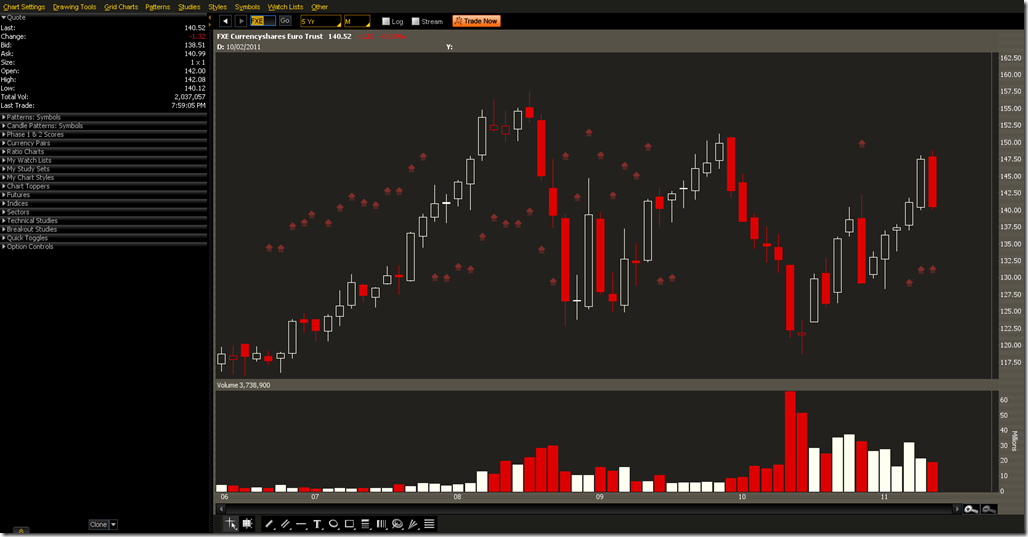
If you don’t have access to FX trading, then a similar play can be done using ETFs and Options.  FXE is the Euro ETF.  Notice that the candles are similar to EUR/USD.  It doesn’t track perfectly so keep that in mind.  Shorting the ETF directly would require a lot of collateral.  It’s possible to do, but you would tie up a lot of capital.

2011-05-14-FXE-PROPHET


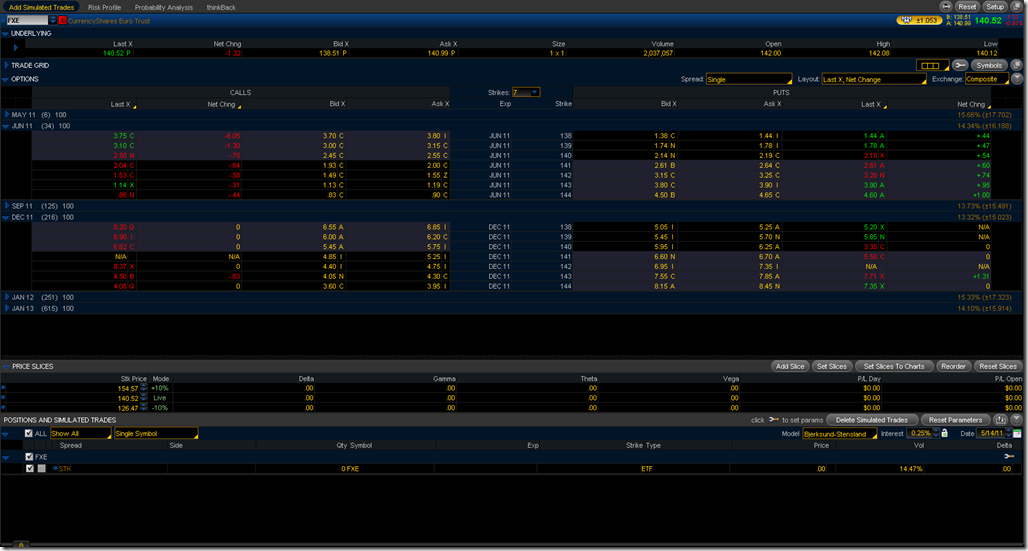
A short term play with options would be to assemble an ATM long Put.  The June 140/138 Put can be bought for $76 per contract.  Which would allow for us to reach maximum profit if FXE reaches 138.  The net max profit for this trade would be 200-76 = 124 per contract. 

A longer term strategy could be to buy the 138 strike Put and begin selling/rolling the June/September 138 strike.  There is potential for this to drop to 134 or 130 which correspond to the 50% and 61.8% Fibonacci retracement respectively. 
2011-05-14-StockAndOptionQuoteForFXE

AUDUSD – Where can it go


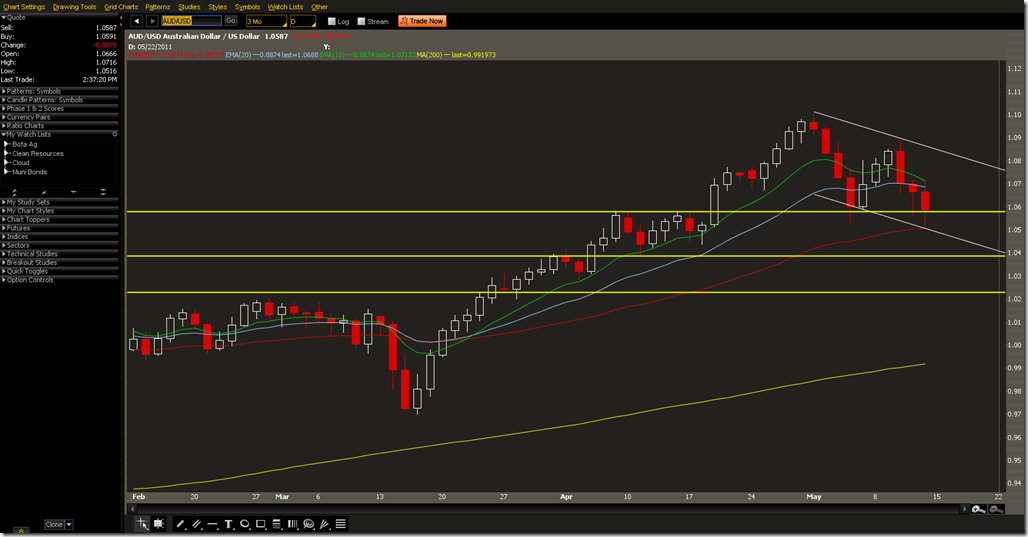
AUD/USD is near an important support level.  Today it bounced off the 50MA  within a down channel and is above the resistance it saw in April.  For a quick scalp look for it to drop before first support at 1.0580 then a exit around the 50MA near 1.0507.  That’s about 70 pips worth of movement.  Playing bounces within the trend, the support levels, and 50MA can increase the odds of success.

2011-05-13-AUDUSD-PROPHET

GBPNOK – British Pound vs. Norwegian Krone


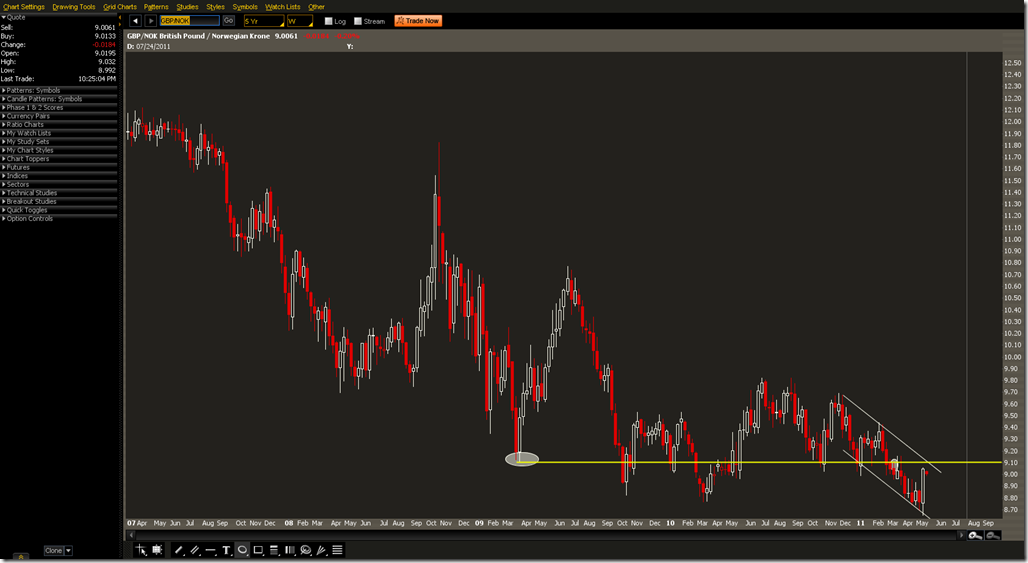
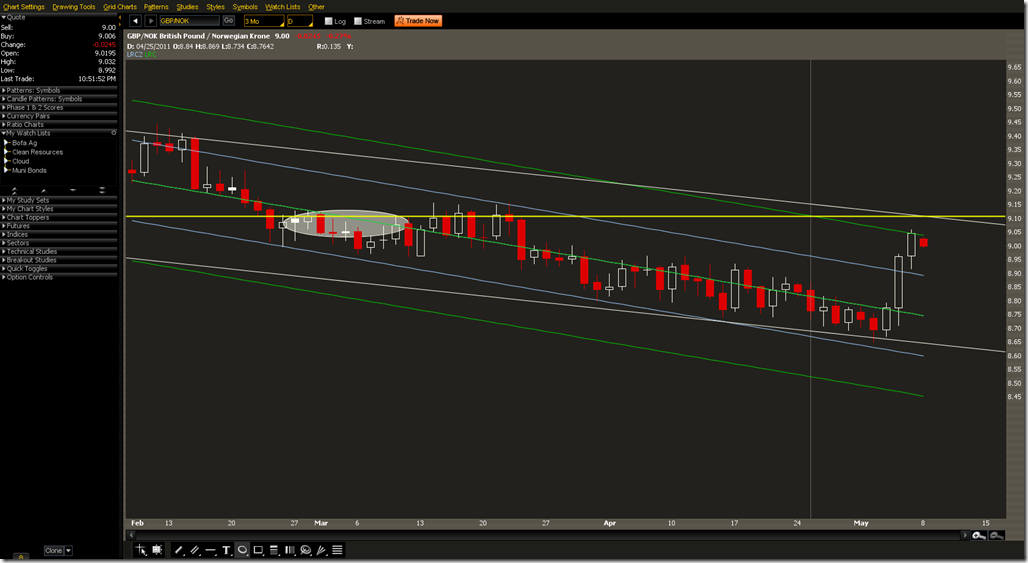
Alternate on the USD/NOK trade since the pattern is similar.  Due to some recent statements by the ECB the USD has been on a tear so there is some risk with    What we’re looking at here is


Sell Limit: GBP/NOK 9.10378
Buy Limit: GBP/NOK 8.80000
Buy Stop: 9.20000

Max Loss: 192.44
Max Gain: 607.56


2011-05-08-GPBNOK-PROPHET


The pair bounced off the Linear Regression Channel also indicating close to this level might be a good interesting.

2011-05-08-GBPNOK-LRC-PROPHET

USDNOK – US Dollar vs. Norwegian Krone Trade


This was one of the trades discussed on Money in Motion.  The idea is that oil will be going up again and rather than using commodities to make money on the move, it’s possible to use currencies.  Since Norway is an oil rich country it is the subject of the trade.  In order to buy oil, foreign countries have to convert their money into that of the seller.  This increases demand for the Norwegian Krone.  The USD has some interesting technicals in relation to the Krone which makes it an complimentary currency to the trade.

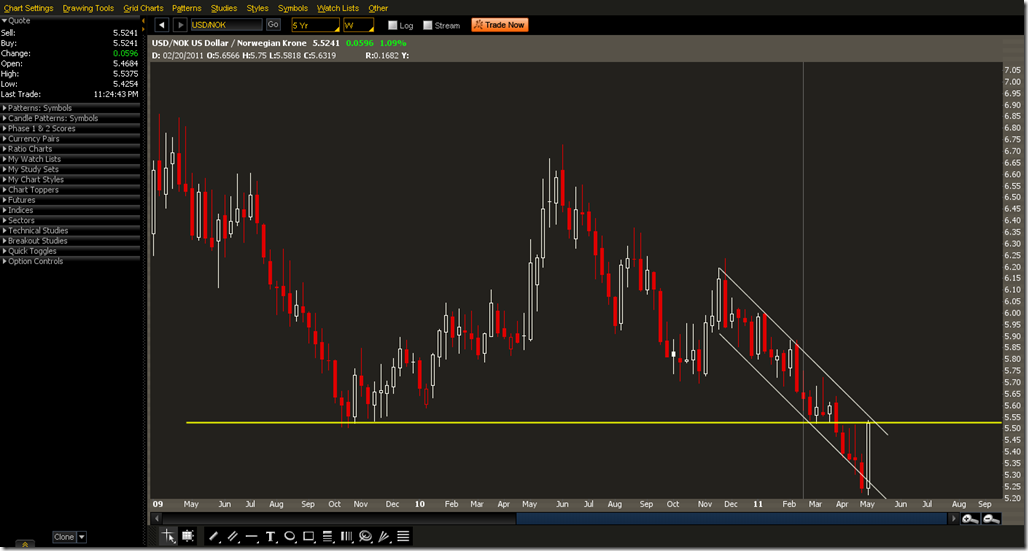
On this weekly chart we can see multiple bottoms in Q4 2009.  Since we’re below that support, it will act as resistance.  The USD/NOK pair is in a channel now.  This week it neared the upper end of the channel which also is at resistance from Q4 2009. 

We would want to wait for a bounce off the trend line and support before shorting the USD and getting long the NOK.  Variations on this entry should be made to accommodate a bounce down.

Sell Limit: USD/NOK 5.55000
Buy Stop: USD/NOK 5.60000
Buy Limit: USD/NOK 5.30000

This gives us roughly $100 of risk per contract with a maximum gain of $500 per contract if we hit 5.30000

2011-05-07-USDNOK-PROPHET

HES –Trade in HESS


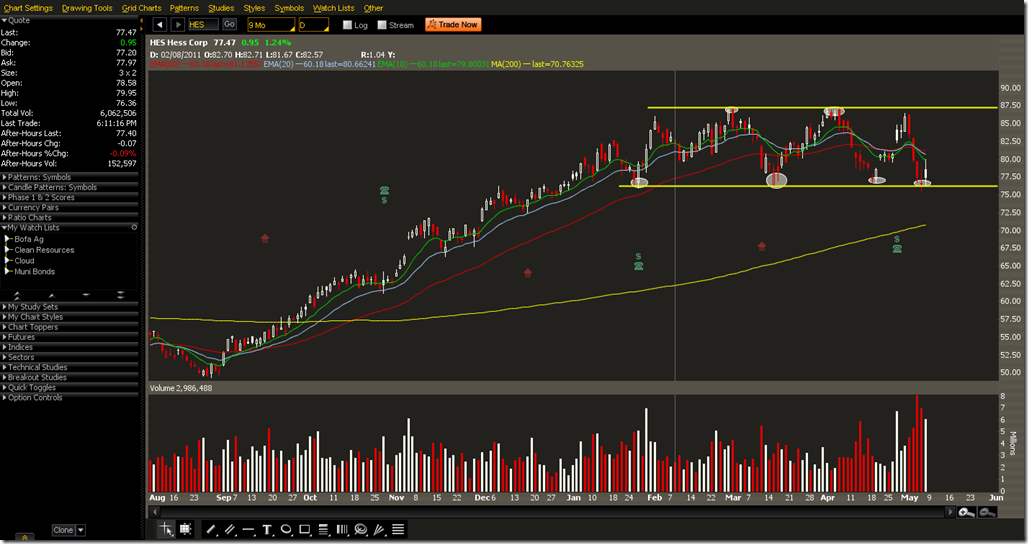
HESS is trading in a range and has bounced off support.  There are multiple bottoms near $75 and multiple tops near $87.50.  One way to play this is through Iron Condors. Optionally, we would want to leg into the call side since ATM Calls are worth more than what we can get right now.

Iron Condor

Sell May 11  75 PUT
Buy May 11 72.5 PUT
CREDIT .59

Sell May 11  87.5 CALL
Buy May 11 90 CALL
CREDIT .09

If we want to get more directional for a debit we could purchase an ATM Call at 77.50. 

Buy May 11 77.5 CALL
DEBIT 2.22

It’s all a matter of style.  The total downside risk for both trades is about the same.  The Call buy has more upside potential from here.


2011-05-06-HES-PROPHET

SPX Iron Condor + Put Calendar


This is an idea that we heard about today.  The structure involves selling an Iron Condor and then hedging risk using a Put Calendar.

An Iron Condor is a neutral strategy where you write and sell option contracts to a buyer.  Meaning you are betting that the stock will stay between two points until the options expire.  In this example we would do the following:

Sell 1390 Call
Buy 1410 Call
Sell 1280 Put
Buy 1270 Put

As long as the SPX stays between 1280 and 1390 on 5/20/2011 we will make money. We are asking for $435 per contract.  Our maximum profit on 4 contracts of SPX is $1740.  Our maximum loss is $6260 which occurs if SPX is below 1270 or above 1410.  This can be seen in the risk profile screen below.  The break even line at 0 intersects with the red risk plot for the date 5/20/2011.  Today is illustrated by the white line. There is a lot of upside risk in this trade, but the market starting to get tired so a pull back for a short amount of time is likely.

Stock-Analyze---SPX-2011-04-06


To take some of the downside risk off we can buy a Put Calendar.  This will make money as SPX drops in value. This would be done by:
Sell May 1275 Put
Buy June 1275 Put

By selling the May Put, we reduce the cost of buying the June Put.  Since Calendar options tend to gain value with an increase in volatility (an increase in the VIX) we only need to buy 1 contract for roughly $935. This also skews the P/L curve. In the picture below we have added a Vol Adj of +20% to simulate the VIX at at 36.90.  This is no too far out of line since the VIX was at 31.50 two weeks ago.  I have also changed the simulated stock price to 1270.08, which is close enough to our maximum loss.  Notice the P/L Open column.  If SPX is near 1270 which would be the maximum loss of $6260 had we simply sold the four Iron Condors.  However due to the spike in volatility and the appreciation of the Put Calendar our position would be worth $3143.  That’s roughly a $9000 swing from loss to profit, assuming everything shakes out this way.  Of course the VIX could move more or less than what we projected if things go bad.  That is the disadvantage of Calendar Options, since we have to guess where the VIX might be in a worst case scenario. 

By combining the Iron Condor and the Put Calendar we have collected

Iron Condor $1740 Credit
Put Calendar $935 Debit
Total: $805 Credit.

By submitting this order we immediately receive $805 deposited into our brokerage account and we get to keep all of it if SPX is between 1270 and 1390. The Put Calendar protects us if the market suddenly crashes and we actually end up making more if it does crash.  Buying Put Options is a great insurance strategy.

Stock-Analyze---SPX-2011-04-06

When Anonymous Attacks Sony Go Short

Today we have a purely speculative idea based on past history.  Since Sony foolishly decided to litigate their customer base for modifying their own hardware they are now in the crosshairs of Anonymous.  Shortly after Anonymous turned their attention to Bank of America, there was a market pull back.

Now that Anonymous has turned their attention to Sony we might be able to play the same strategy, especially if Anonymous manages to interfere with any revenue generation.  If we look at a recent daily chart of Sony we can see that it formed a descending triangle with a break down below support.  Today it continued below a double top on 3/14 & 3/15.  In after hours trading Sony continued lower. 


Stock-Chart---SNE-2011-04-06

If Sony opens lower tomorrow we might have a short opportunity.  Hopefully as time goes on Anonymous will learn to coordinate their DDOS attacks against public companies with weak chart patterns at key support and resistance levels for maximum impact. That will make it easier to get a larger move if Anonymous’ target is resting at support.

Regardless of whether or not you support Anonymous, they do serve a purpose in the information security ecosystem.  As security professionals we can see how effective anti-DDOS hardware is by observing the results of Anonymous’ attacks.  As traders, we can take advantage of the news of Anonymous’ DDOS attacks and play the short side of the trade.  Charlie Sheen would call that bi-winning!


He who is prudent and lies in wait for an enemy who is not, will be victorious. – Sun Tzu

Green Energy Deployment Needs Resiliency Just Like Information Security


Christopher Mims has a great piece at Grist on the state of Germany’s photo voltaic(PV) system compared to Japan’s Fukushima nuclear complex.  We can skip over the math arguments that the PV system in Germany is 20% more efficient than Fukushima at the height of the day.  The point now is that Fukushima is producing ZERO watts of electricity.  The design of future green energy systems should incorporate concepts from Information Security.

Information Security attempts to build the CIA triad.  CIA is

  • Confidentiality – Is the data protected from unauthorized access?
  • Integrity – Has the data been tampered with?
  • Availability – Is the data available for people to use when they want it?


We will look at Availability.  Information systems are typically protected by an Uninterruptable Power Supply (UPS) which has a battery backup.  If electricity is lost the batteries continue to power the servers.  In most cases the UPS is supplemented by a diesel or natural gas generator to recharge the batteries.  In very scenarios where interruption of service is a high impact event, a company will deploy backup servers along with the resilient electrical resources in a geographically separate area.  In some cases this can be cross continent or across the world.  The objective is to prevent a total loss of your business from a geographically isolated event.  The second objective is to provide the customers with a service that is available when they want to use it.  For example, a business in Japan may have located servers in another country.  If the datacenter were destroyed by the tsunami, the severs in the other country would take over automatically and the customers would not know the difference or know immediately that something was wrong.

Green energy needs the “A” principle of CIA in order to be useful.  Pundits on both the green energy side and fossil fuels side have advocated for a one size fits all solution.  Windmills, solar panels, and ocean power have not reached the efficiency levels to replace fossil fuels.  Fossil fuels are reliable, but are subject to supply chain disruption and competition for the resources themselves which results in higher prices for everyone concerned.

Green energy sources should initially supplement fossil fuels and should be used much like a hedging strategy in a stock portfolio.  If there is a disruption of the main power plant, the green alternatives can take up part of the slack while the main facility is being repaired.  As more green capacity is brought online it can be built in a decentralized manner.  This reduces the exposure that consumers face from the loss of a centralized power source.  Green energy is great, but if it is unusable due to a natural disaster the effort is wasted.