Fast Cash Financial Services Trade FCFS


FCFS came up on one of our screens this week.  They operate a large number of pawn shops (488) and short term loan stores (124) in The US and Mexico.  The economy is not going to turn around for individuals any time soon, so it would be reasonable to make a bullish call on the pawn and payday loan industry.  Prior resistance was at the 40 level which has turned into support since then with a few dips below on bad market days.  FCFS is also resting on trend line support from February 2010.  The 50 SMA is currently around 45 and the 200 SMA is around 40.  The 200 SMA is trending up so 40 seems like a reasonable support point. 

There are several ways of approaching this trade.  An equity limit buy at the trend line with a stop below the trend line for a tight stop,  Setting a wider stop below 40 might also be viable, but that’s a $3 loss from where we are right now. 

Another angle would be to enter this trade using options.

For this trade we would sell the October 40 PUT  at the MID for .45  Then buy the November 35 PUT for .50.  This is done for a net debit of .05.  The maximum loss is $500 per contract.  In this strategy we are looking to get assigned the stock at 40.  Essentially we’ve put in a limit order to buy at 40 and are collecting .45 for placing that order.  The November 35 PUT acts as a hedge in case the stock has a large decline.  At expiration of the October 40 PUT we can roll them into a November 40 Put to create a Bull Put Spread.  The MID is worth about 1.35 credit. After accounting for the debit of .05, the net credit is 1.30  If the stock does drop below the short put by options expiration we get to keep the 1.30 credit.  The widest stop should be around the 36 level if this is approached as a short term trade.  A longer term option would be to accept assignment and sell the long put for an extrinsic/intrinsic value.  This approach gives defined risk and allows for multiple exit strategies.  As always a good trader should pick the best strategy and stay with it. 
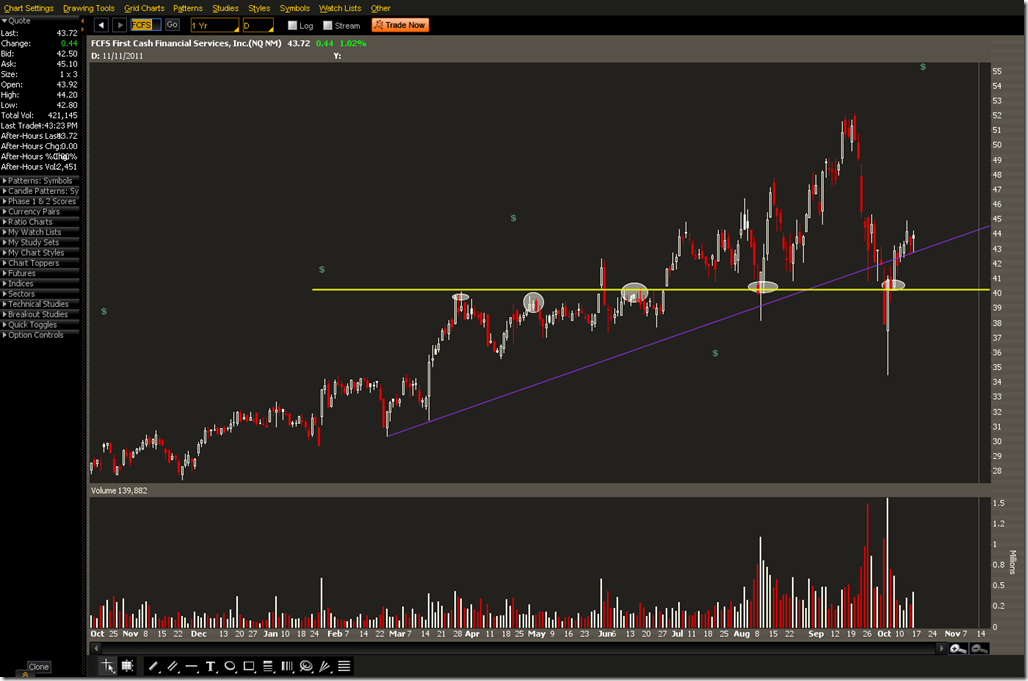
2011-10-15-FCFS-PROPHET

IWM Iron Condor


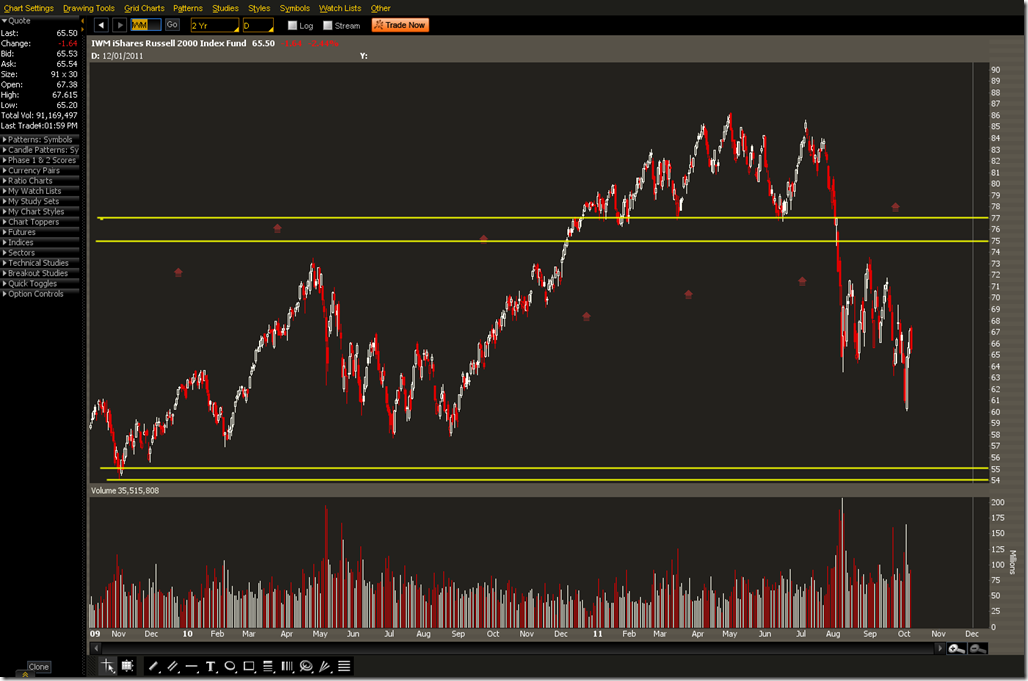
The market has been a little crazy lately and unless you’re scalping intraday it’s hard to find something that works well.  What we’re testing out here is a very wide unbalanced Iron Condor on IWM.  Below is a two year chart showing how wide this spread is.  The lows were from November 2009 and there are several support levels that we must go through to reach our loss point.  To the upside there is resistance at multiple levels starting in August with a recent head and shoulders pattern and multiple points in 2010.  There’s a lot to go through before it reaches either side of the condor.

2011-10-07-IWM-PROPHET


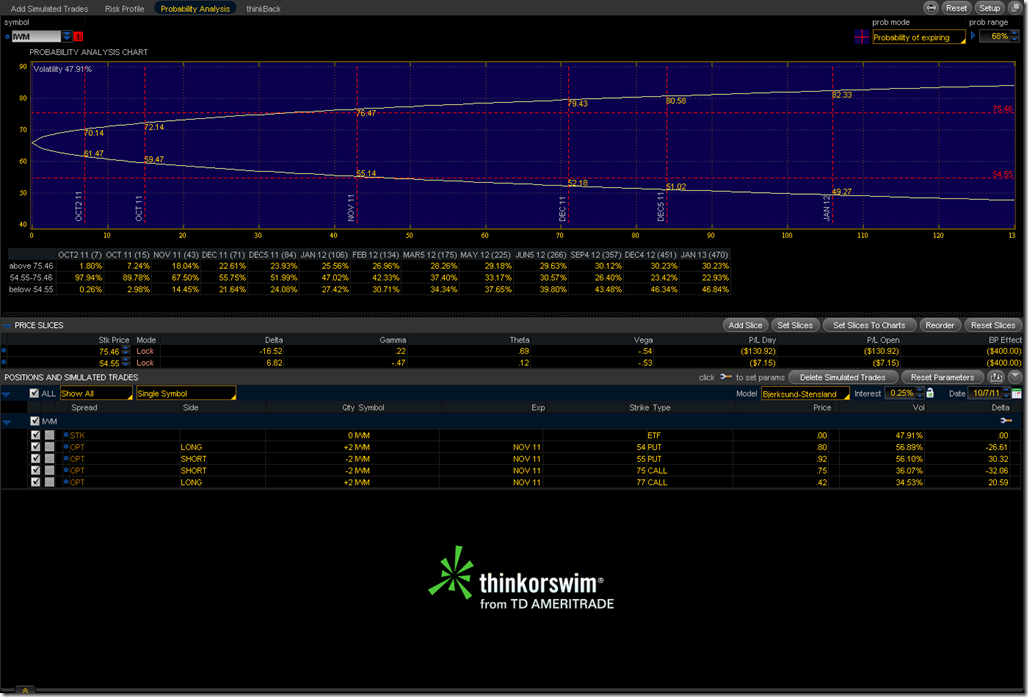
The Trade is to sell the 75/77 Call and the 55/54 Put.  At this point we’re more worried about downside risk than upside, so the the downside is 1 strike wide with a max loss of 55 per contract.  The upside is 2 strikes wide with a max loss of 155 per contract.  This is something that depends mainly on Theta (time decay) so direction isn’t that important.  If things start to move above the H&S to the upside some equity or call positions in TNA could be used to hedge.  For the downside long equity or call positions in TZA can be a hedge.  Based on things as they stand today this trade has a 70% chance of expiring between the two strikes.  This is a relatively low risk position and offers opportunities to hedge risk to cover the max loss should the stock move that far.

2011-10-07-IWM-Analyze

Checkpoint Trade CHKP


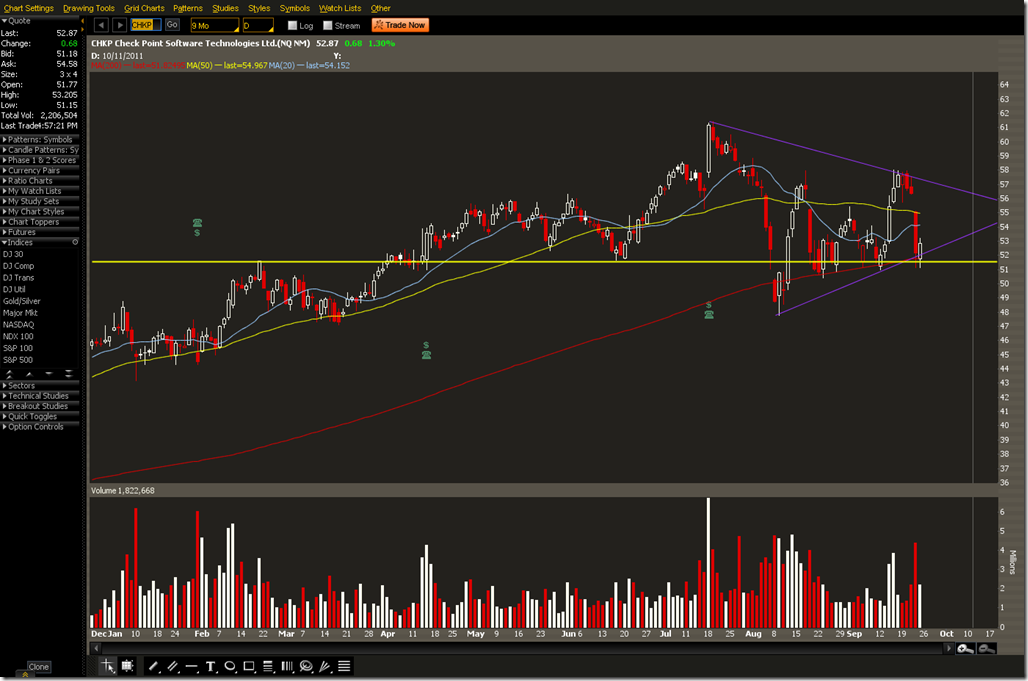
The well known maker of firewalls and other security solutions has a nice setup here.  Prior resistance from February 18 held up as support at the 200 DMA. CHKP also closed back inside the trend line on the 23rd.  Earnings is set for October 20 which would account for a big squeeze if the stock stays inside the triangle.  The weekly trend is still up so this is likely to be a continuation.

Aside from playing long equity there are a few options here. 

One is to sell an ATM Vertical option.  This assumes that the 200MA, the February resistance, and the trend line will hold up.  The 50MA was resistance on Thursday and that is relatively close to resistance on August 18 and also Near the end of April.  Closing half a position close to the 50MA would be one way of reducing this exposure.  This is the setup SELL -1 VERTICAL CHKP 100 OCT 11 52.5/50 PUT @.95 LMT

The other option is to bet on a break out after earnings on October 20.  IV for October is 50% while November is 45%.  A call calendar above the resistance at 58 could be one way to capture a break out.  BUY +1 CALENDAR CHKP 100 NOV 11/OCT 11 60 CALL @.55 LMT

If we were looking to pin close to the center of the triangle BUY +1 CALENDAR CHKP 100 NOV 11/OCT 11 57.5 CALL @.73 LMT or BUY +1 CALENDAR CHKP 100 NOV 11/OCT 11 55 CALL @.85 LMT could also be good choices.  These would be taken off close to expiration, but before earnings.


2011-09-25-CHKP-PROPHET

The Hartford to Offer Data Breach Insurance

Good news for small firms.  The Hartford (NYSE: HIG)is now offering data breach insurance targeting small business.  Insurance is a good control to invest in to supplement other information security controls or as the main control if your business is very small.  Some E&O policies may also have riders that cover data breaches.  If you own a business you should review all your policies to be sure that your coverage objectives are met.

Relying on insurance is a form of risk transference.  The policy holder is transferring some of the risk in the form of impact costs to another party.  This can be useful and could potentially save a small business from severe financial damage if it has to absorb the costs of investigating a breach or cover the cost of credit monitoring for its customers. 

In trading terms buying a Put is the same as buying insurance.  The purchaser is given the option to sell their investment for potentially more than the current market price.  An unexpected oil spill or embezzling scandal could be the equivalent of intruders or dumpster divers getting their hands on your customer’s data.

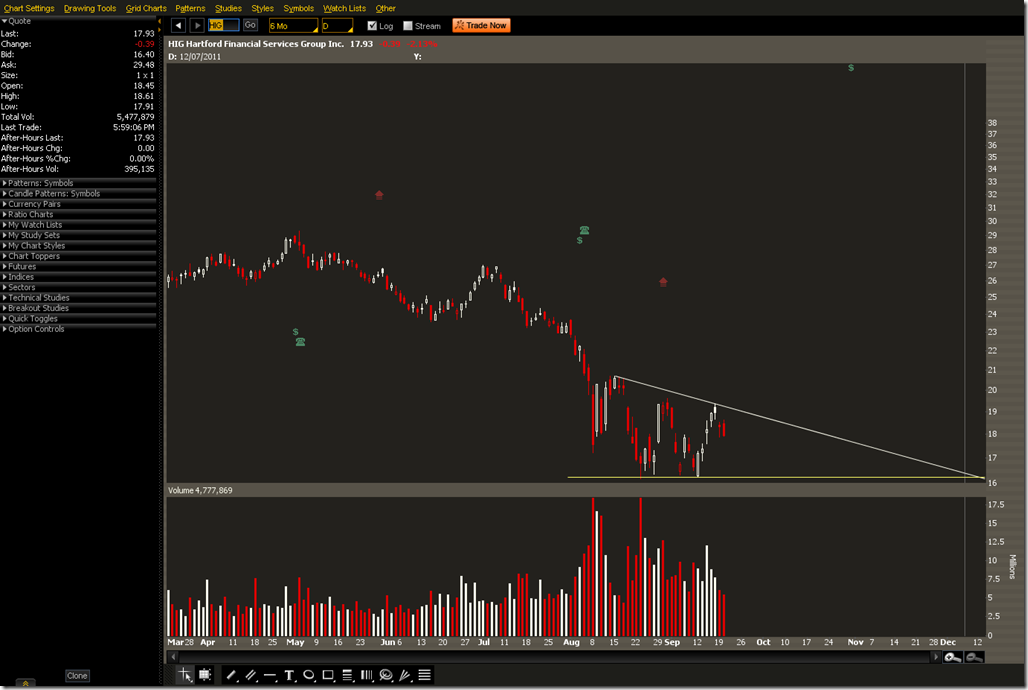
There’s a very small range in HIG.  There is support around 16 so this could be played different ways.  Shorting the stock with a stop above the trend line is one option.  The Oct 18/16 Bear Put Spread is going for .69 and has a max profit of 131.  Since front month IV is higher than November a put calendar may be an alternative if you want to play the descending triangle pattern.  The 16 Oct/Nov Put calendar is going for .47.  There is a possibility the stock could drop to 12 if the descending triangle follows through.2011-09-21-HIG-PROPHET

AUDJPY Ascending Triangle Setup


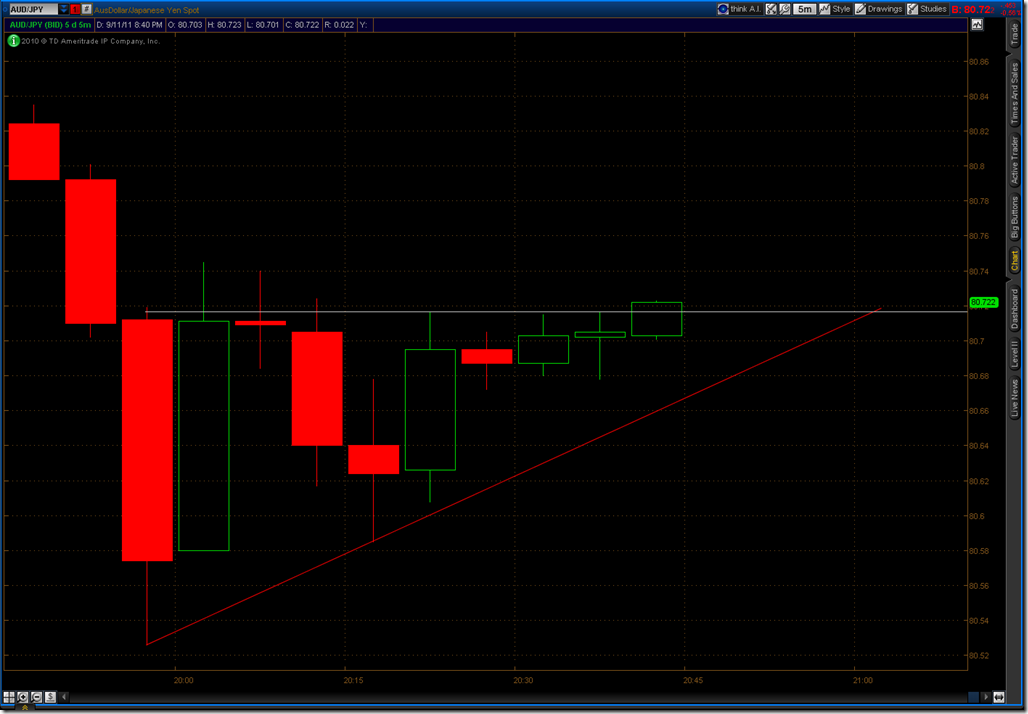
There is an ascending triangle forming on AUD/JPY with a triple top. Ascending triangles tend to be a bullish pattern.  Positioning a buy stop order above resistance is a good strategy to grab the break out.  This one reversed but was worth 20-30 ticks with a tight trailing stop.  Always be on the lookout for patterns to give guidance for buy and sell stop entries. 


2011-09-11-AUDJPY-TOS_CHARTS

USDCHF Short


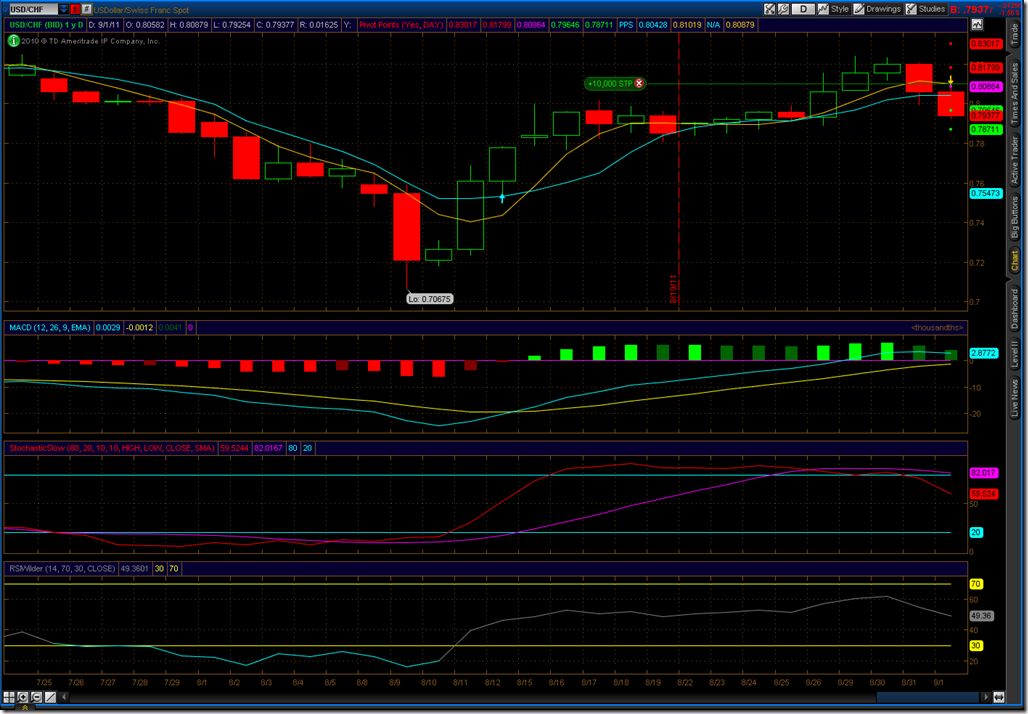
Today there are some nice technical indicators showing on the USD/CHF pair.  The pair topped out at around .82 before turning lower.  Today the Persons Proprietary Signal indicated a sell along with MACD, Stochastics, and RSI starting to point down. A short entry today should be able to run for a few days.

2011-09-01-USDCHF-TOS_CHARTS

Apple Trade Strategy Post Jobs


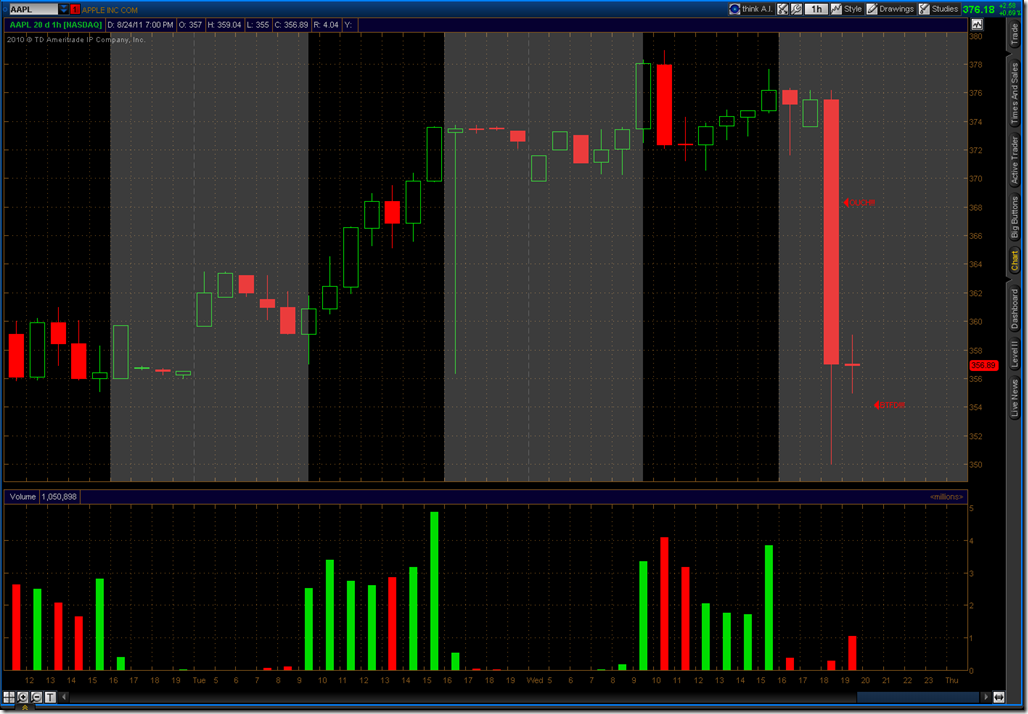
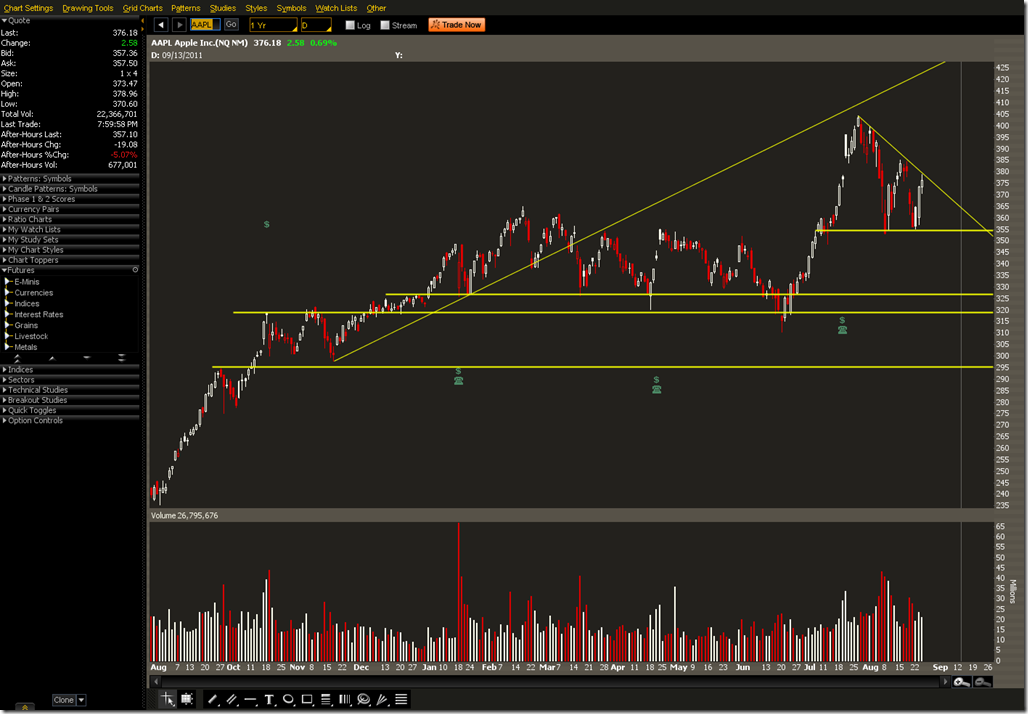
Steve Jobs announced that he is resigning today, sending Apple stock lower. Apple went as low as 350 in the after hours session.  This is a pull back but may not be the time to step into the fire.


2011-08-24-AAPL-TOS_CHARTS

On a daily chart we have several areas to look at.  Around 350 is current support in a descending triangle.  Since there’s bearish news this could completely break down.  Goldman Sachs recommended that their subscribers Sell the January 2012 $300 PUT.  This means the seller agrees to take around $11 in premium and agrees to buy the stock for $300 regardless of how low it goes.  It’s like being an insurance company.  That idea lost 30% today so be glad you didn’t do it.  There are support levels around 325/320 and 300/295.

2011-08-25-AAPL-PROPHET

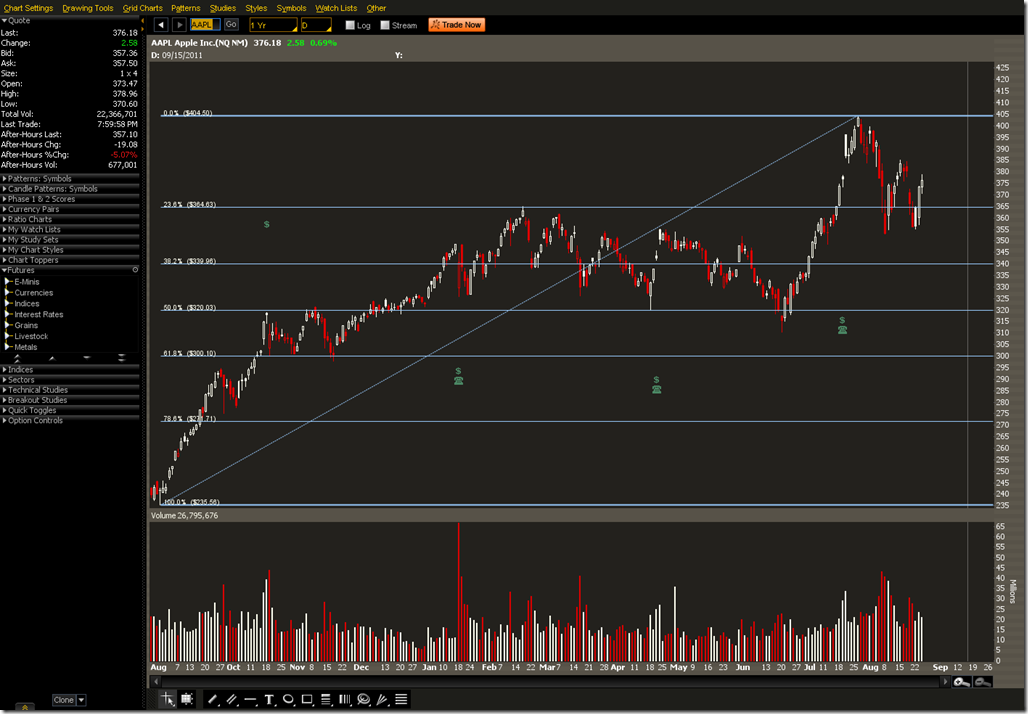
On a one year chart the 320 level corresponds to the 50% Fibonacci level and 300 corresponds to the 61.8% Fibonacci level.  300 seems like a reasonable target.  That is about the height of the descending triangle subtracted from its base.

2011-08-25-AAPL-FIB-PROPHET

A two standard deviation move from this afternoons close is 291.19.  Three standard deviations is 273.44. 

The September 290/285 Bull Put Spread could be a reasonable bet to leave a limit order on. Less likely but safer would be the 275/270 Bull Put Spread.  The order should be for 25% of the width of the spread, in this case 1.25 minimum. 

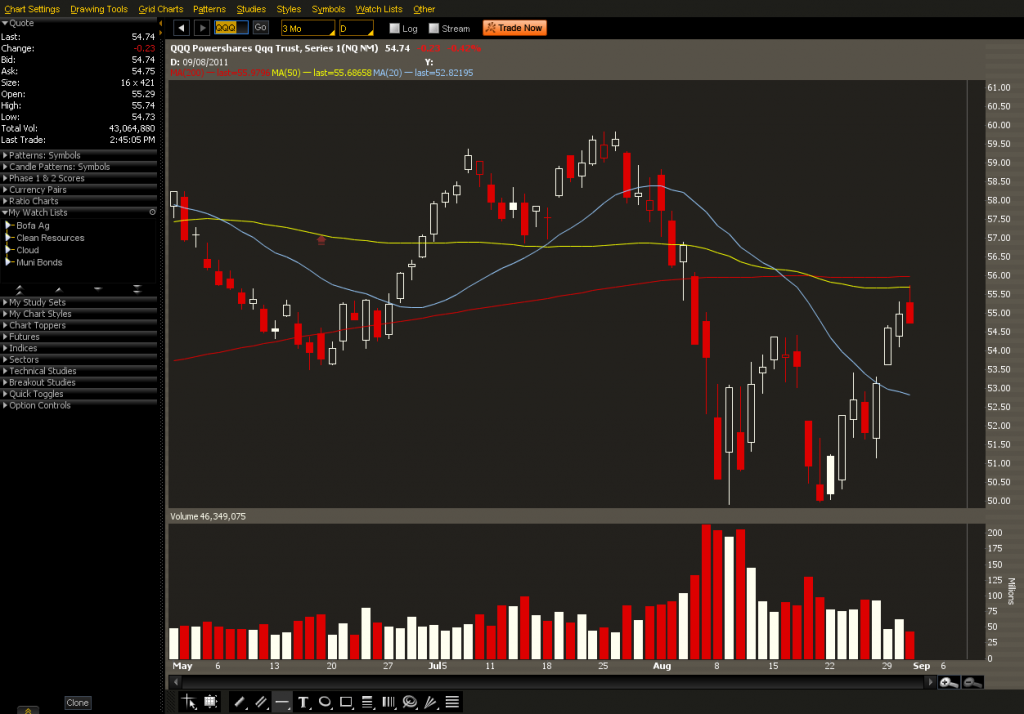
Order size would need to be according to individual taste and risk.  Buying some long puts in QQQ as a hedge with some of the proceeds of making this trade could lessen the pain if the stock plummets past either the second or third standard deviation.

Swiss Franc Setup For Rebound


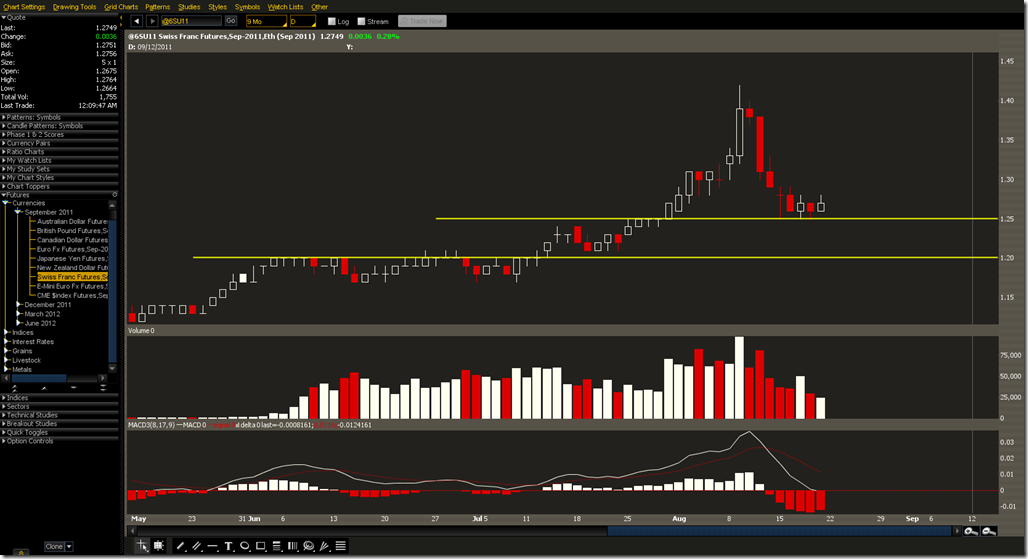
Swiss Franc Futures have triple bottomed at an area near resistance from the end of July.  MACD, Stochastics, and RSI haven’t completely reversed yet and the Persons Proprietary Signal has not indicated a buy yet.  This may be worth watching if it goes sideways for a bit and then reverses its downtrend.  The Chaikin Oscillator is about to move above 0 so this could indicate a bullish move on the Swiss Franc in the next few days.  Any negative news item from Europe should improve the value of the currency along with any discussions of QE3 from the US.


2011-08-22-6S_F-PROPHET

Next Step In The Rollercoaster


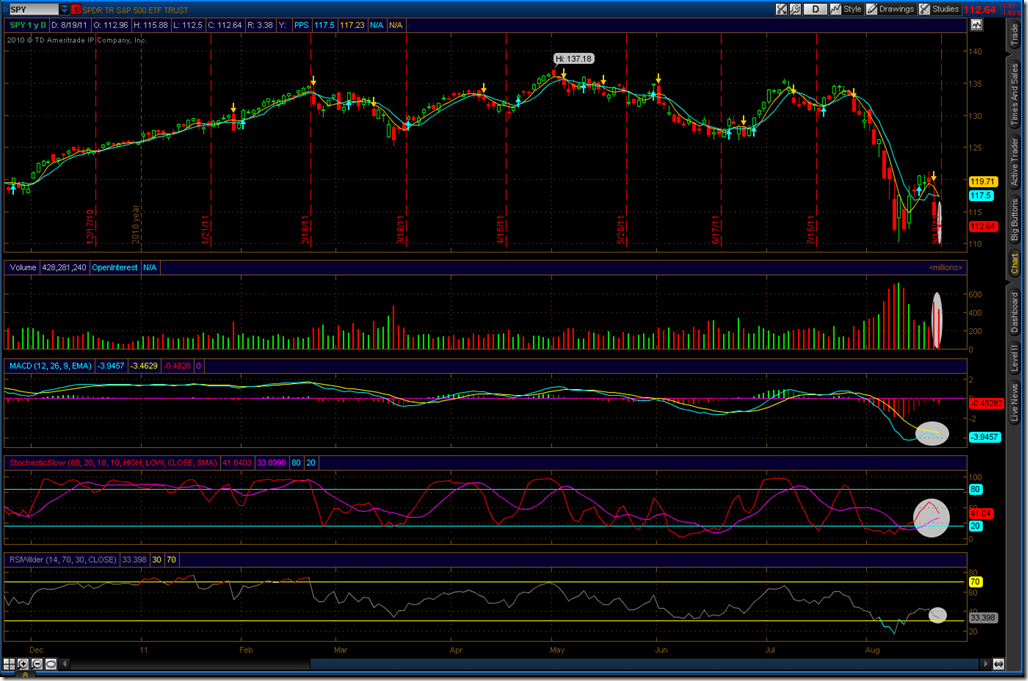
Friday points to a very unhappy day next week.  SPY printed an inverted hammer at the close which is a bearish sign.  Volume was almost as high as the previous day which was also bad, and both days volume is higher than any of the recent good days except 8/9. 

2011-08-20-SPY-ROPHET


Other technical indicators are also pointing down, including MACD, Stochastic, and RSI.  The Persons Proprietary Signal also gave a sell on Thursday.  There may be some support around 112, but after that it could be serious sailing lower.

2011-08-20-SPY-TOS_CHARTS


If you have long positions that are working keep the stops tight, other positions should be cut loose until this volatility blows over.  At the very least getting delta neutral or slightly negative delta would be a good idea in the short term.  Bonds and precious metals seem to be the current hot spot for hedging or speculating.  TLT has been up for the past 4 weeks and GLD has been up for 6 weeks, both showing buy the Persons Proprietary Signal for the same amount of time. 

Some straight Bear Puts on SPY could be a good hedge or speculative position.  Shorting the ES futures is also an option.  In and out trades into some of the 3x Bear ETFs might also work here.  If you are not into trading a wild market it may be best to sell everything and sit this out until we see that things have really turned around.  That will probably be a break above 124-125 on SPY.  There we have old support from mid March, which may be some solid resistance.  Be prepared to short again if it bounces off that point.