Nabors Industries Ltd Trade NBR


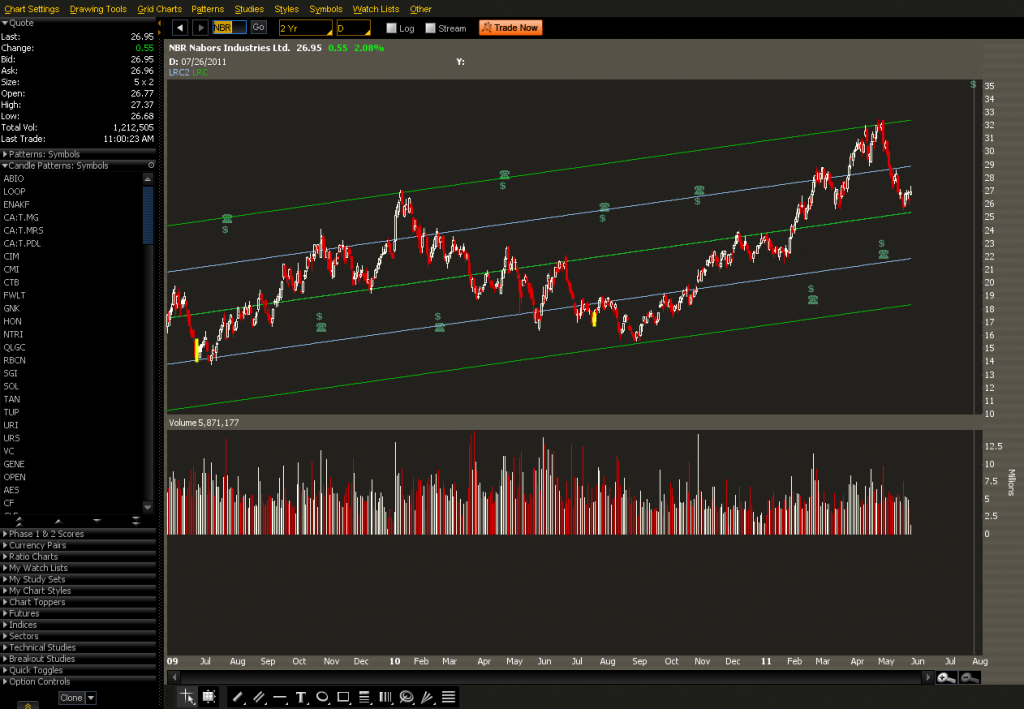
NBR has returned to its Mean and may be a good long candidate.  After testing the mean and bouncing back NBR may be worth entering here.


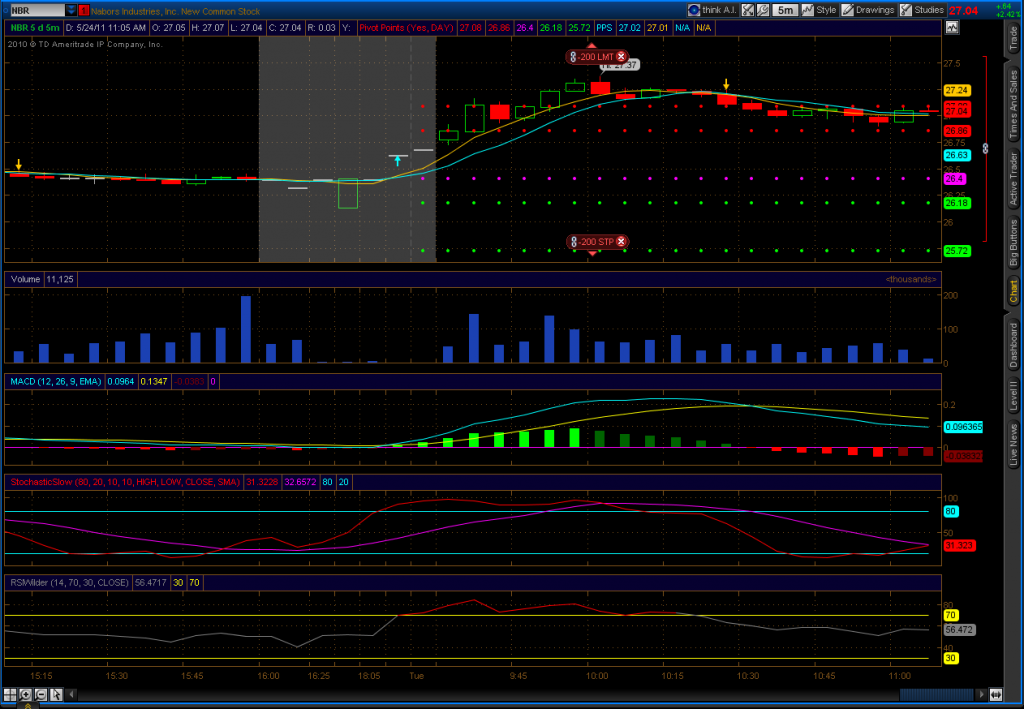
We tried for an entry on 5/24 after seeing NBR lift off.  Since it was above the R2 line using the PivotPoints study we decided to wait for a pull back to at least R1.  R1 is at 26.86 so a limit order at 26.90-26.92 wouldn’t be a bad place to get in.  Around 10:55 our order to enter the position was filled.  We’ve let this one run for a few days now and it is up over .72  The exit target would be in the 32.00-33.00 range Taking half off the table at the first regression channel at around 29.50 might not be a bad strategy as well. 


Sony Continues To Get Punished


Sony shut down several of their Internet services in Canada, Thailand, and Indonesia today. Sony stated that their Thai site was accessed to gain customer information to conduct phishing attacks.  Sony Music Entertainment was also infiltrated leading to source code theft.   Organizations face many security challenges but some level of organization and planning can alleviate some of the headaches caused by a breach.

One popular framework that can be used to help develop your security is ISO 27001.  ISO 27001 provides a management framework to guide organizations in making sure they have all the bases covered when it comes to security.  ISO 27001 is not just about technology security, but also includes sections on physical security, and legal compliance.  It is considered by most organizations a complete approach to managing an organization’s security program. 

These sections are of importance in improving the security standing of an organization before and after a data breach.

A.10.6 Network security management – Objective: To ensure the protection of information in networks and the protection of the supporting infrastructure

A.13.2 Management of information security incidents and improvements – Objective: To ensure a consistent and effective approach is applied to the management of information security incidents.

There are specific topics in each section such as defining network controls and incident handling procedures.  A little planning before an incident can go a long way to making the cleanup and prevention of future intrusions much easier to deal with .

EURUSD Entry and Exit


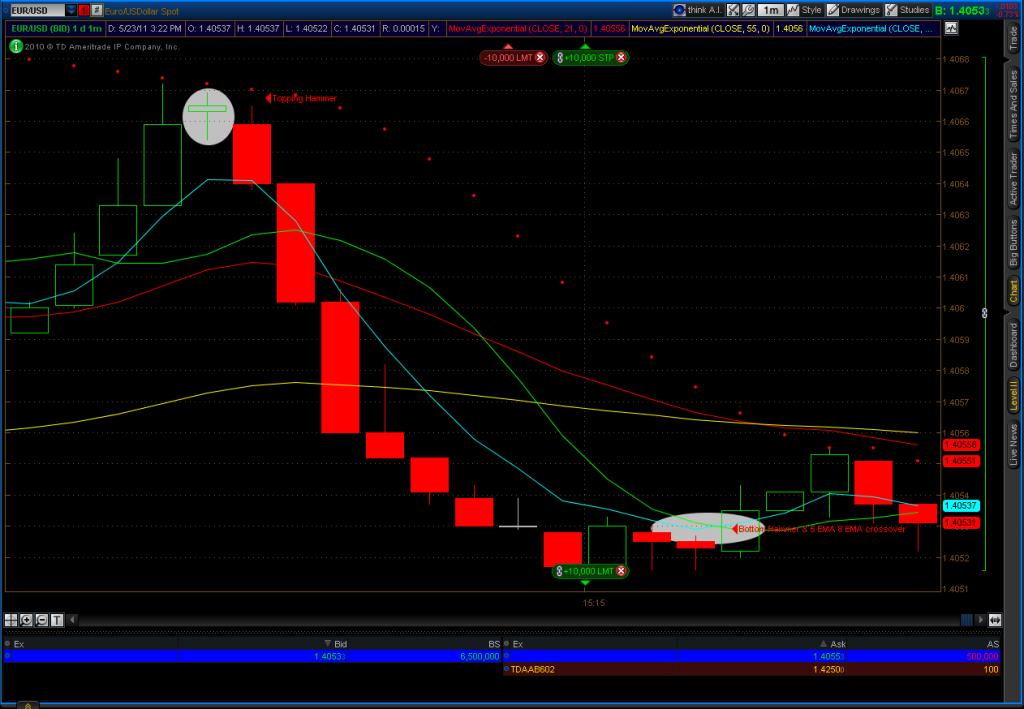
Some friends have asked some trading techniques we use.  Here we are trading the Euro vs the US Dollar (EURUSD).  The technique can be found in the book FX Bootcamp’s Guide to Strategic and Tactical FOREX Trading.  I recommend the book if you plan on trading FX and the technique can also work with Futures and Equities.  Basically we setup a chart with four moving averages.  They are:

  • 5 EMA
  • 8 SMA
  • 21 EMA
  • 55 EMA


To over simplify When the 21 line is above the 55 line things are very bullish.  The opposite holds true when the 21 line is below the 55 line.  The 5 and the 8 are used for short term confirmation.  There may be pullbacks on the 5/8 period if the 21 line is above the 55 line, but they may reverse quickly.

We also added the ParabolicSAR study to help set initial stop loss orders.  The ParabolicSAR dots are above the bars on the chart when things are in a bearish trend and below the bars when the trend turns bullish.  For this trade we are using four different moving averages and ParabolicSAR as a confirming indicator.

When observing the chart we observed a short uptrend.  The fourth candle did not cross the ParabolicSAR marker, indicating that the currency pair had not experienced a strong reversal.  The next candle is an Evening Star and still did not cross the ParabolicSAR.  The following candle turned bearish giving us a good indication that the trend would continue.  Near the bottom of the trend there were two Hammer candles in a row followed by a green candle. The 5 EMA crossed above the 8 SMA around the same time.  That was an indication to exit the short position.  We were able to ride this trade from 1.4064 down to 1.4053.  That is 11 pips between the two.  On 10 contracts that would be roughly $110 in gains over a roughly 11 minute timeframe.  We did this on a 1 minute chart which can be very bumpy and result in a lot of false signals that have bumped us out of the trade.  By adding ParabolicSAR we and learning the various candle shapes and patterns we were able to pick an entry using the rollercoaster 1 minute chart.  Most traders tend to do fine using the 5, 15, or 30 minute chart for short to medium ranges.  

This provides a high level overview.  Nothing can substitute for education and practice.  There are many techniques that work in different situations.  Combining what works for the individual trader is always the best approach.  This should also serve as a warning to anyone who tries to trade without putting in the time to learn winning techniques before trading with real money.


EURUSD FXE Trade


Unless you’ve been hiding under a rock you know that the PIIGS nations are really hammering Europe.  We keep hearing about the collapse of the US Dollar, but is the Euro in more trouble than the dollar?  Now that QE2 is off the table that might be changing.  The S&P 500 has had a hard time breaking above its recent channel and has been going sideways for a few days now.  How can we take advantage of the situation?

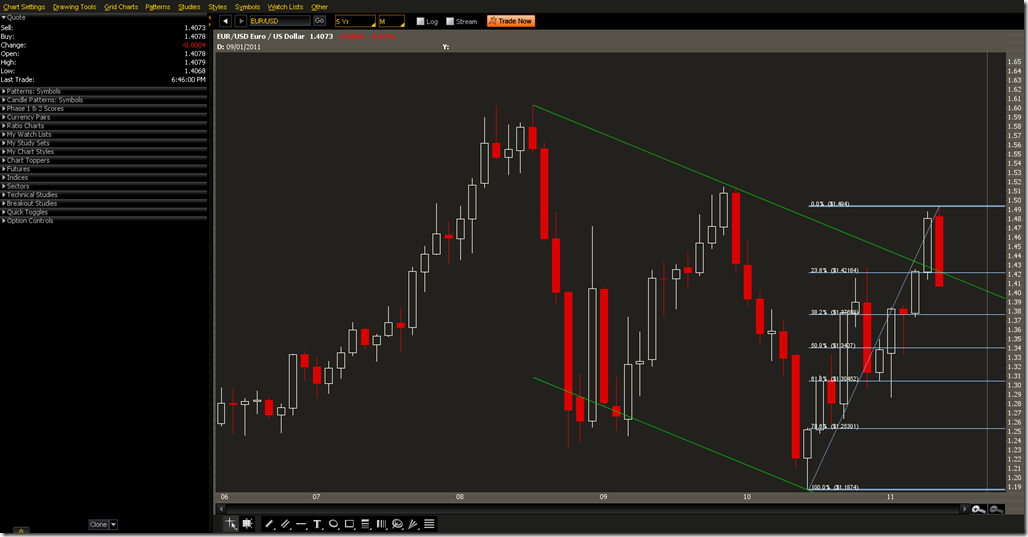
A monthly chart will let us visualize what is happening here.  Last month EUR/USD made it above the down channel, but it returned back to the channel this month.  There are several interesting things happening here. The channel intersects with the 23.6% Fibonacci level this month and the underlying broke down.  This month’s candle is also a bearish engulfing candle. On a weekly chart EUR/USD topped out on 4/24, then formed a bearish engulfing candle the following week and has a confirmation candle the week after.  Last week’s candle was also the first weekly close inside the trend line and below the 23.6% Fibonacci level.

Shorting EUR/USD around 1.4150 with a 100-150 pip stop to begin with would be a good entry strategy.  The target price to cover would be close to 1.3800 at the next Fibonacci level.  This trade is worth $350 per contract with 100-150 worth of risk depending on where the stop order is placed.
 

2011-05-14-FXE-PROPHET

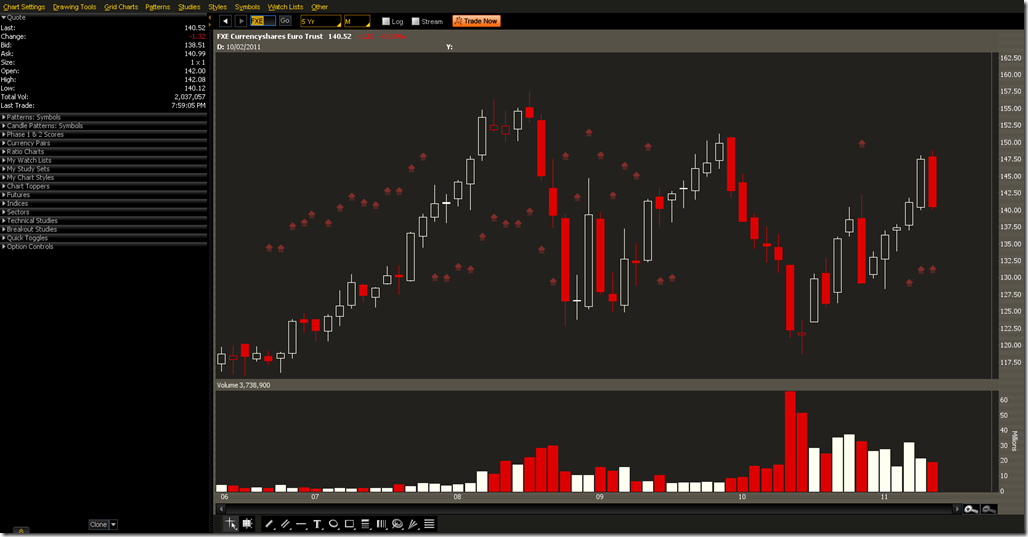
If you don’t have access to FX trading, then a similar play can be done using ETFs and Options.  FXE is the Euro ETF.  Notice that the candles are similar to EUR/USD.  It doesn’t track perfectly so keep that in mind.  Shorting the ETF directly would require a lot of collateral.  It’s possible to do, but you would tie up a lot of capital.
2011-05-14-FXE-PROPHET


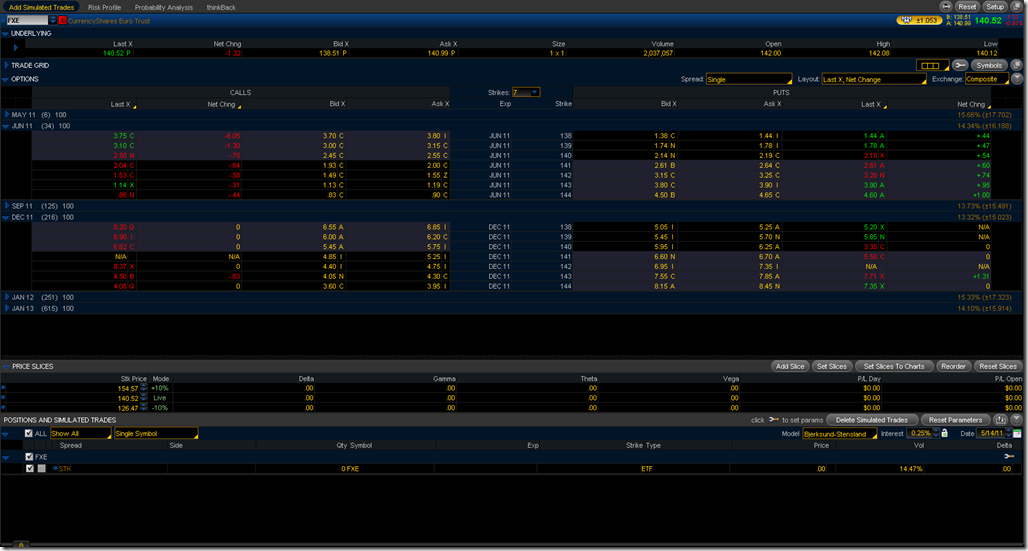
A short term play with options would be to assemble an ATM long Put.  The June 140/138 Put can be bought for $76 per contract.  Which would allow for us to reach maximum profit if FXE reaches 138.  The net max profit for this trade would be 200-76 = 124 per contract. 

A longer term strategy could be to buy the 138 strike Put and begin selling/rolling the June/September 138 strike.  There is potential for this to drop to 134 or 130 which correspond to the 50% and 61.8% Fibonacci retracement respectively. 
2011-05-14-StockAndOptionQuoteForFXE

AUDUSD – Where can it go


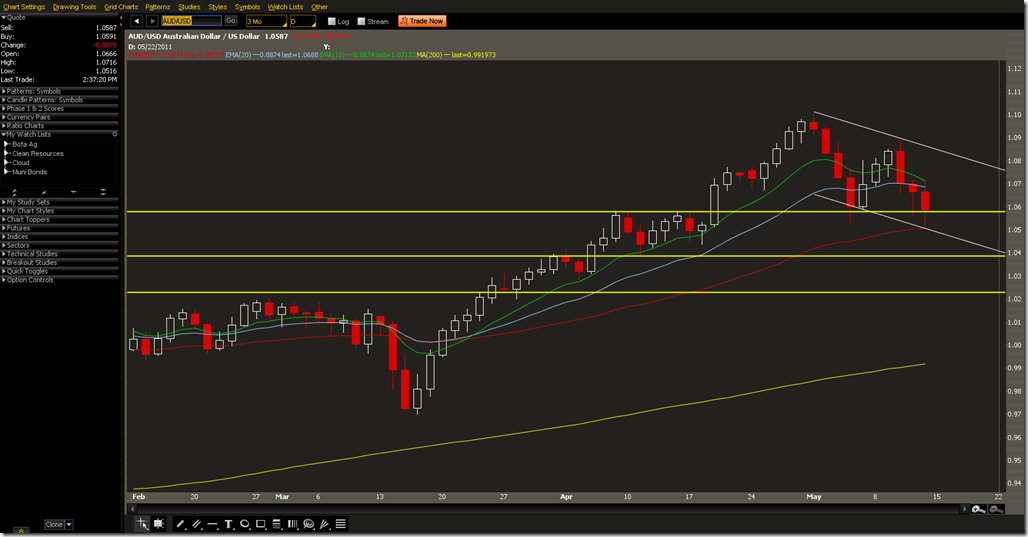
AUD/USD is near an important support level.  Today it bounced off the 50MA  within a down channel and is above the resistance it saw in April.  For a quick scalp look for it to drop before first support at 1.0580 then a exit around the 50MA near 1.0507.  That’s about 70 pips worth of movement.  Playing bounces within the trend, the support levels, and 50MA can increase the odds of success.

2011-05-13-AUDUSD-PROPHET

GBPNOK – British Pound vs. Norwegian Krone


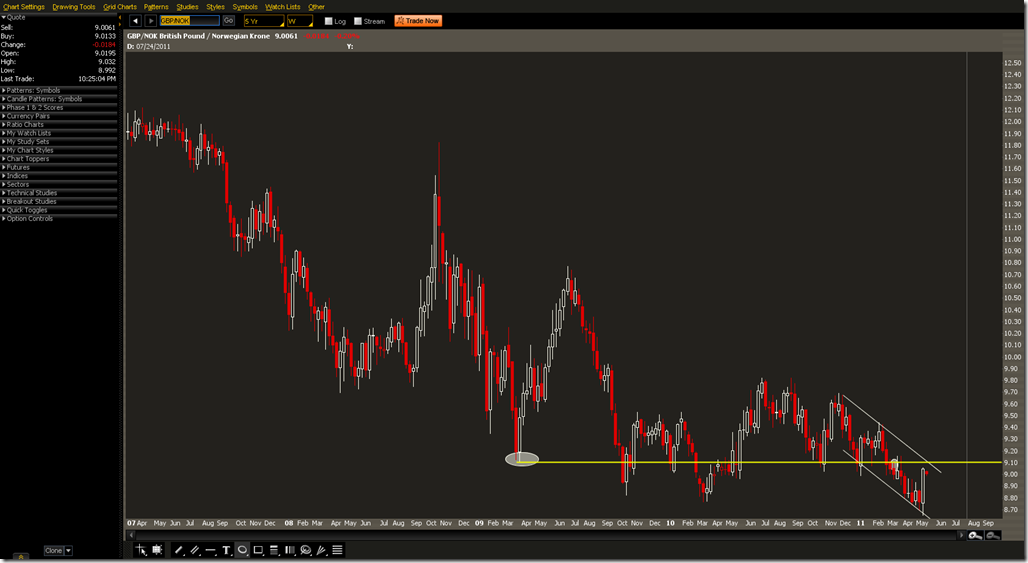
Alternate on the USD/NOK trade since the pattern is similar.  Due to some recent statements by the ECB the USD has been on a tear so there is some risk with    What we’re looking at here is


Sell Limit: GBP/NOK 9.10378
Buy Limit: GBP/NOK 8.80000
Buy Stop: 9.20000

Max Loss: 192.44
Max Gain: 607.56


2011-05-08-GPBNOK-PROPHET


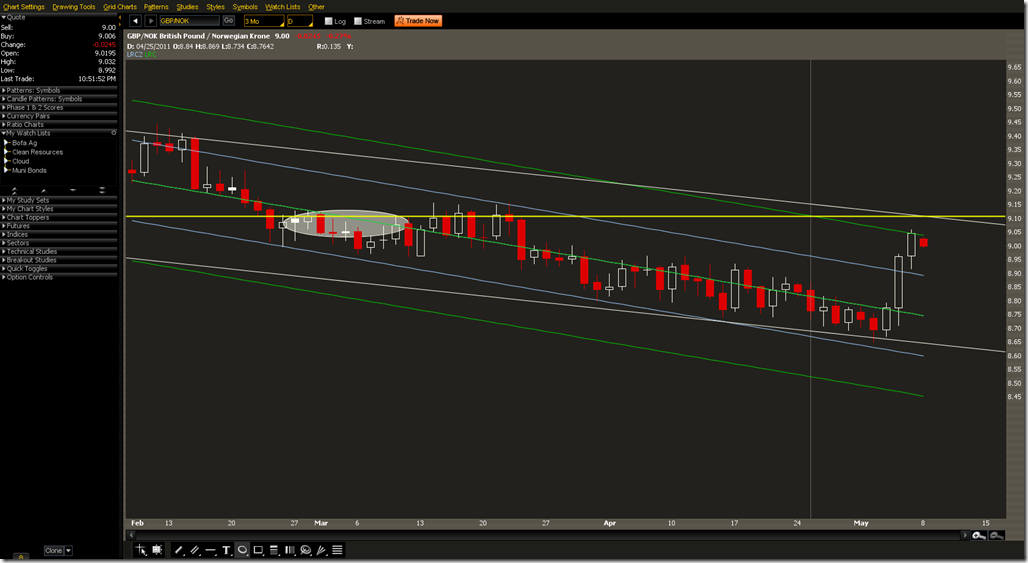
The pair bounced off the Linear Regression Channel also indicating close to this level might be a good interesting.

2011-05-08-GBPNOK-LRC-PROPHET

USDNOK – US Dollar vs. Norwegian Krone Trade


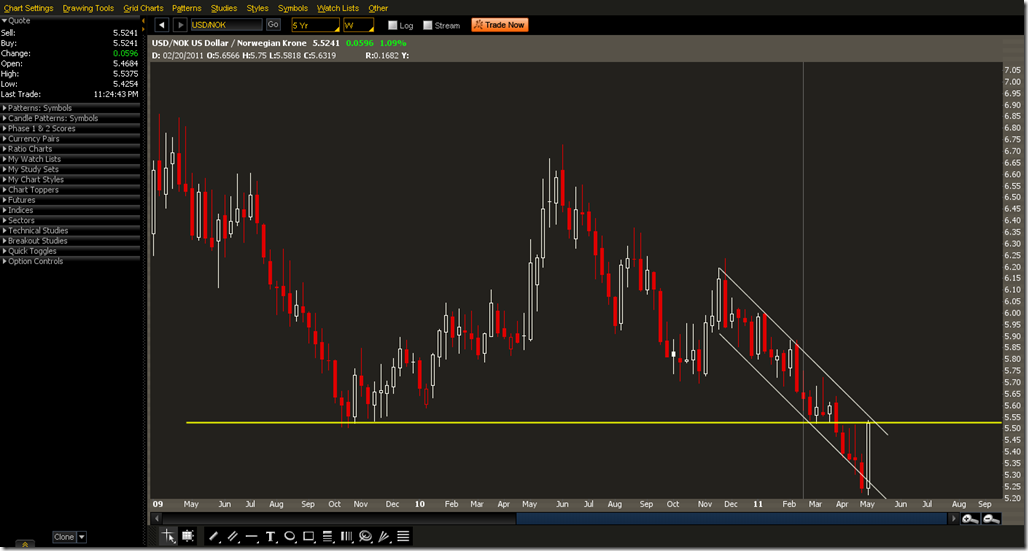
This was one of the trades discussed on Money in Motion.  The idea is that oil will be going up again and rather than using commodities to make money on the move, it’s possible to use currencies.  Since Norway is an oil rich country it is the subject of the trade.  In order to buy oil, foreign countries have to convert their money into that of the seller.  This increases demand for the Norwegian Krone.  The USD has some interesting technicals in relation to the Krone which makes it an complimentary currency to the trade.

On this weekly chart we can see multiple bottoms in Q4 2009.  Since we’re below that support, it will act as resistance.  The USD/NOK pair is in a channel now.  This week it neared the upper end of the channel which also is at resistance from Q4 2009. 

We would want to wait for a bounce off the trend line and support before shorting the USD and getting long the NOK.  Variations on this entry should be made to accommodate a bounce down.

Sell Limit: USD/NOK 5.55000
Buy Stop: USD/NOK 5.60000
Buy Limit: USD/NOK 5.30000

This gives us roughly $100 of risk per contract with a maximum gain of $500 per contract if we hit 5.30000

2011-05-07-USDNOK-PROPHET

HES –Trade in HESS


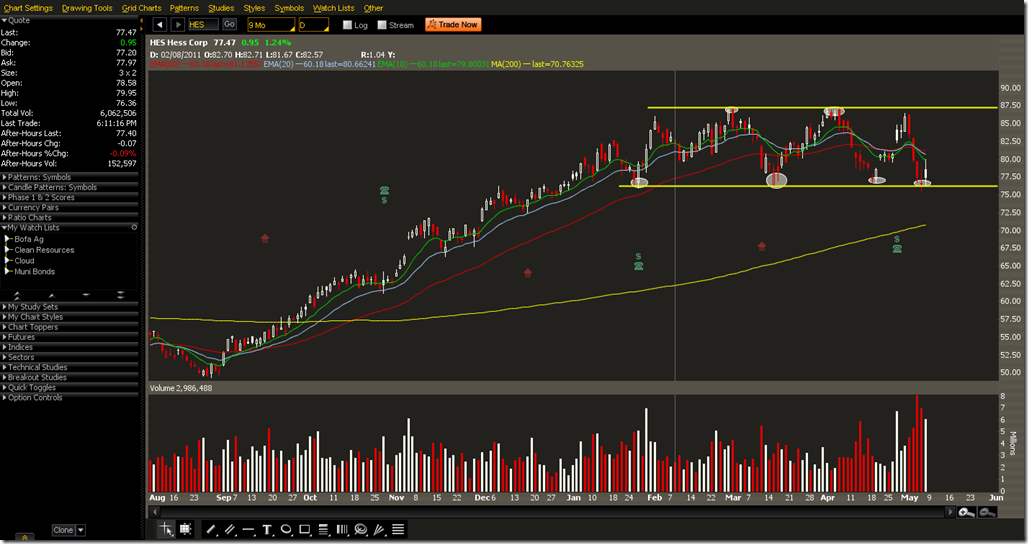
HESS is trading in a range and has bounced off support.  There are multiple bottoms near $75 and multiple tops near $87.50.  One way to play this is through Iron Condors. Optionally, we would want to leg into the call side since ATM Calls are worth more than what we can get right now.

Iron Condor

Sell May 11  75 PUT
Buy May 11 72.5 PUT
CREDIT .59

Sell May 11  87.5 CALL
Buy May 11 90 CALL
CREDIT .09

If we want to get more directional for a debit we could purchase an ATM Call at 77.50. 

Buy May 11 77.5 CALL
DEBIT 2.22

It’s all a matter of style.  The total downside risk for both trades is about the same.  The Call buy has more upside potential from here.


2011-05-06-HES-PROPHET