XHB Vertical Trade

The Shadow Trader ProSwing report announced an entry into a short XHB position.  This turned out to be hard to borrow, but there are always options.

2012-01-20-XHB-Analyze


Shadow trader suggested the following prices

Price: $18.80
Stop: $19.75
Target: $17.50 (first target)

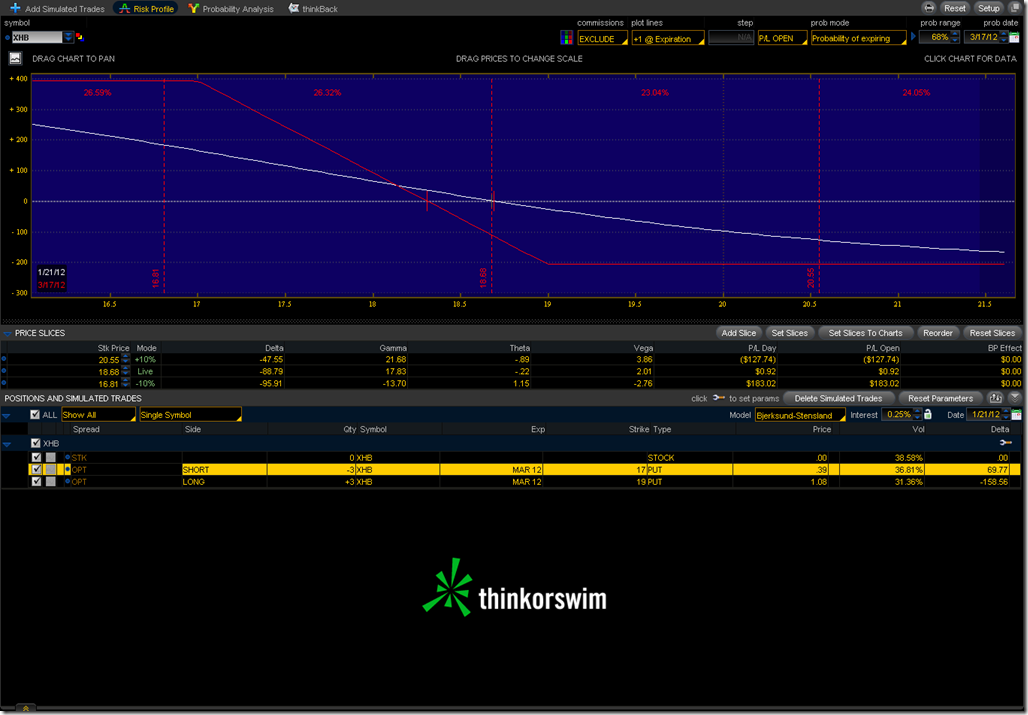
We’re going to use the ITM March 19 Put and the OTM March 17 Put to minimize Theta.  This puts our entry price at $69 per contract.  Max gain is $393 per contact on March expiration.  Stopping out 19.75 means we lose about $80 per contract.  Assuming the direction holds this has a decent risk/reward.  One strategy here is to exit when the target is reached, which would be worth at least $115 per contract depending on the Theta loss in the short put.
IWM Iron Condor


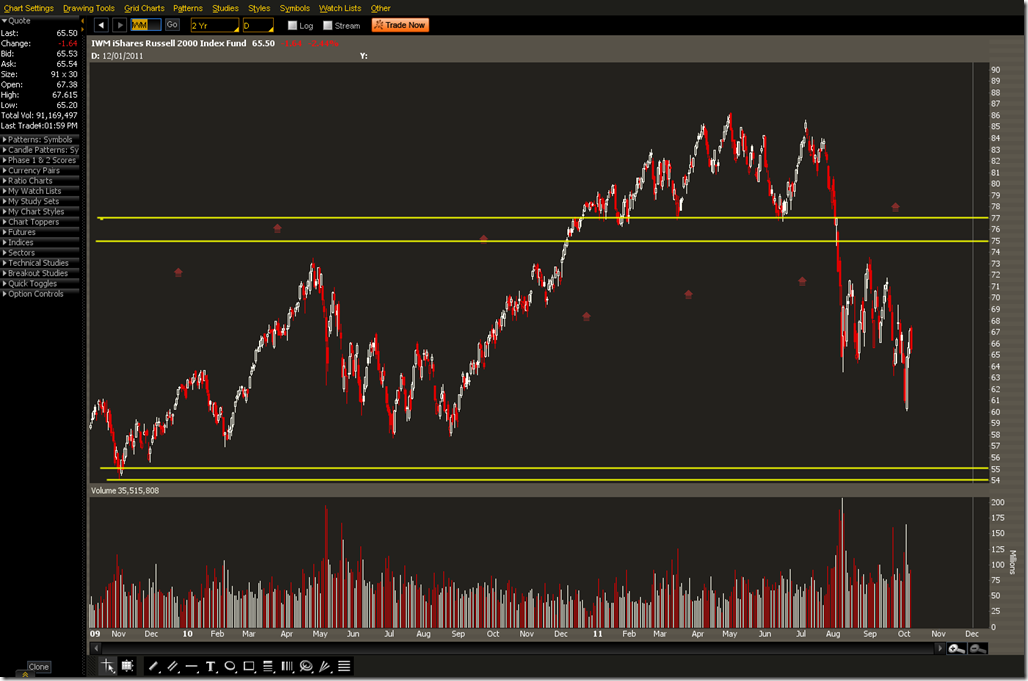
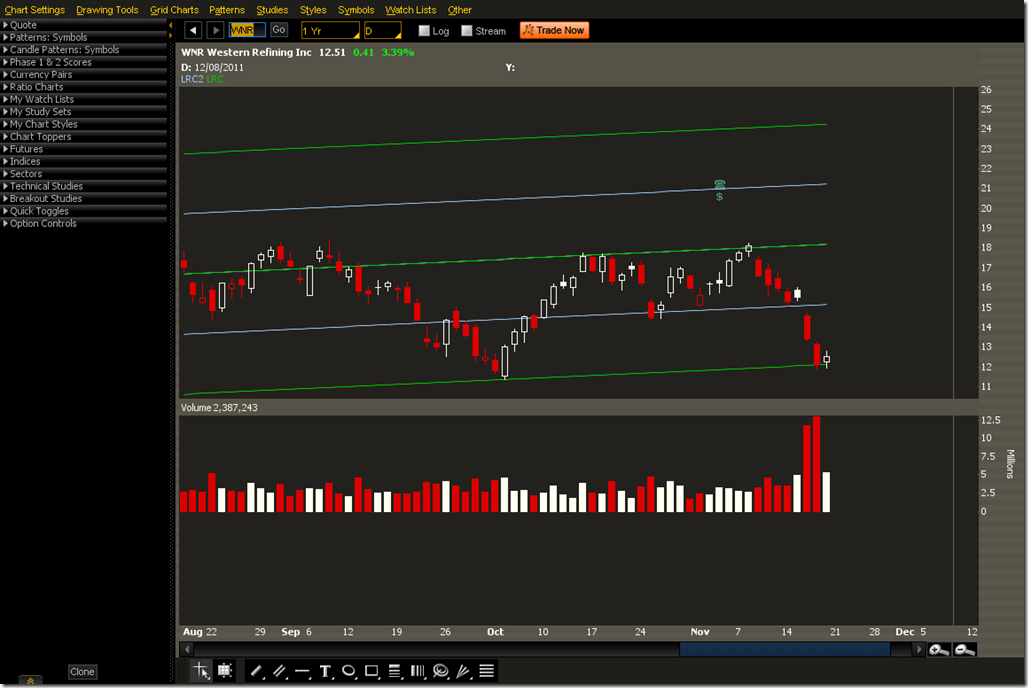
The market has been a little crazy lately and unless you’re scalping intraday it’s hard to find something that works well.  What we’re testing out here is a very wide unbalanced Iron Condor on IWM.  Below is a two year chart showing how wide this spread is.  The lows were from November 2009 and there are several support levels that we must go through to reach our loss point.  To the upside there is resistance at multiple levels starting in August with a recent head and shoulders pattern and multiple points in 2010.  There’s a lot to go through before it reaches either side of the condor.

2011-10-07-IWM-PROPHET


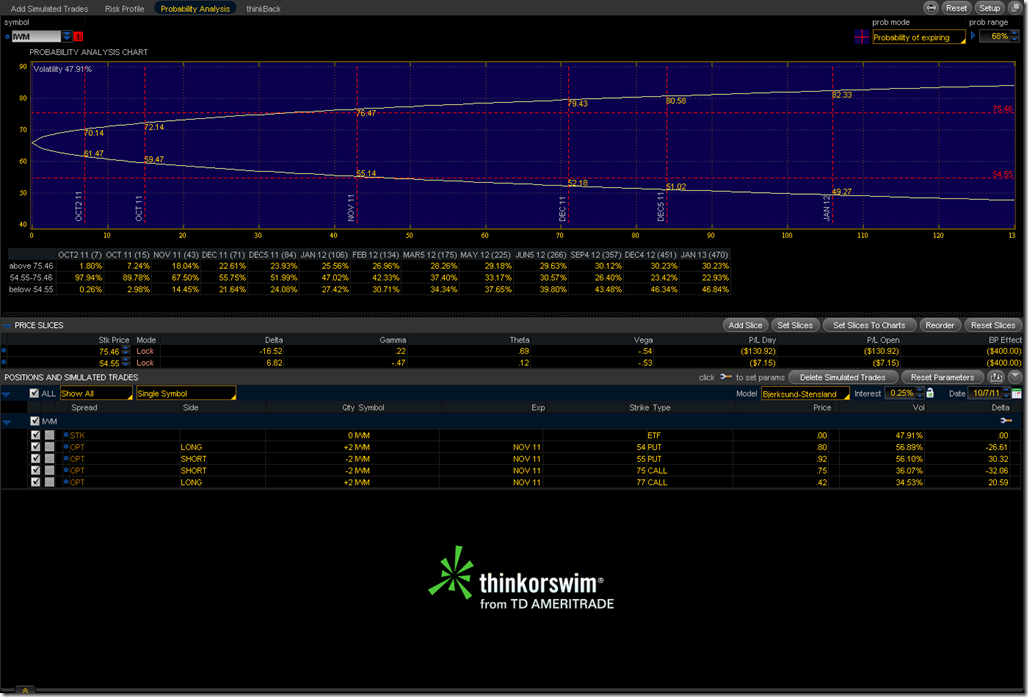
The Trade is to sell the 75/77 Call and the 55/54 Put.  At this point we’re more worried about downside risk than upside, so the the downside is 1 strike wide with a max loss of 55 per contract.  The upside is 2 strikes wide with a max loss of 155 per contract.  This is something that depends mainly on Theta (time decay) so direction isn’t that important.  If things start to move above the H&S to the upside some equity or call positions in TNA could be used to hedge.  For the downside long equity or call positions in TZA can be a hedge.  Based on things as they stand today this trade has a 70% chance of expiring between the two strikes.  This is a relatively low risk position and offers opportunities to hedge risk to cover the max loss should the stock move that far.

2011-10-07-IWM-Analyze

Checkpoint Trade CHKP


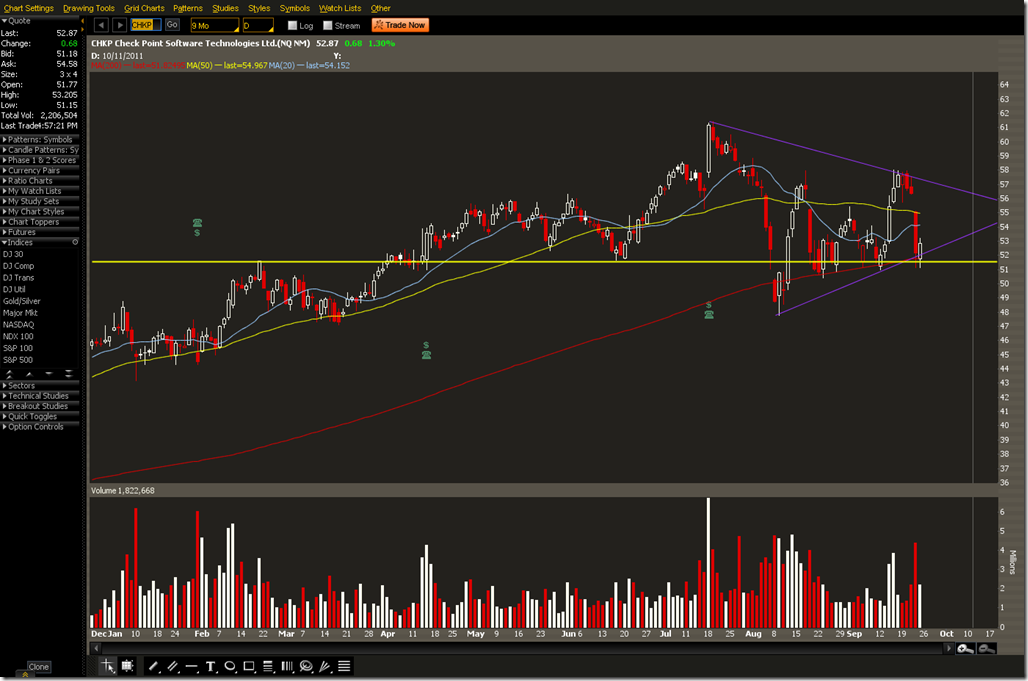
The well known maker of firewalls and other security solutions has a nice setup here.  Prior resistance from February 18 held up as support at the 200 DMA. CHKP also closed back inside the trend line on the 23rd.  Earnings is set for October 20 which would account for a big squeeze if the stock stays inside the triangle.  The weekly trend is still up so this is likely to be a continuation.

Aside from playing long equity there are a few options here. 

One is to sell an ATM Vertical option.  This assumes that the 200MA, the February resistance, and the trend line will hold up.  The 50MA was resistance on Thursday and that is relatively close to resistance on August 18 and also Near the end of April.  Closing half a position close to the 50MA would be one way of reducing this exposure.  This is the setup SELL -1 VERTICAL CHKP 100 OCT 11 52.5/50 PUT @.95 LMT

The other option is to bet on a break out after earnings on October 20.  IV for October is 50% while November is 45%.  A call calendar above the resistance at 58 could be one way to capture a break out.  BUY +1 CALENDAR CHKP 100 NOV 11/OCT 11 60 CALL @.55 LMT

If we were looking to pin close to the center of the triangle BUY +1 CALENDAR CHKP 100 NOV 11/OCT 11 57.5 CALL @.73 LMT or BUY +1 CALENDAR CHKP 100 NOV 11/OCT 11 55 CALL @.85 LMT could also be good choices.  These would be taken off close to expiration, but before earnings.


2011-09-25-CHKP-PROPHET

AUDUSD – Where can it go


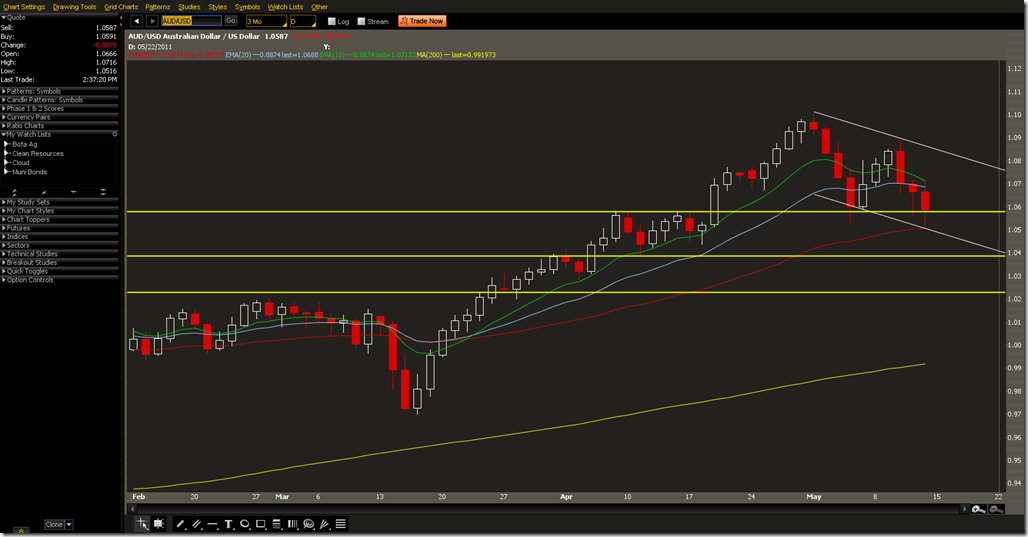
AUD/USD is near an important support level.  Today it bounced off the 50MA  within a down channel and is above the resistance it saw in April.  For a quick scalp look for it to drop before first support at 1.0580 then a exit around the 50MA near 1.0507.  That’s about 70 pips worth of movement.  Playing bounces within the trend, the support levels, and 50MA can increase the odds of success.

2011-05-13-AUDUSD-PROPHET

GBPNOK – British Pound vs. Norwegian Krone


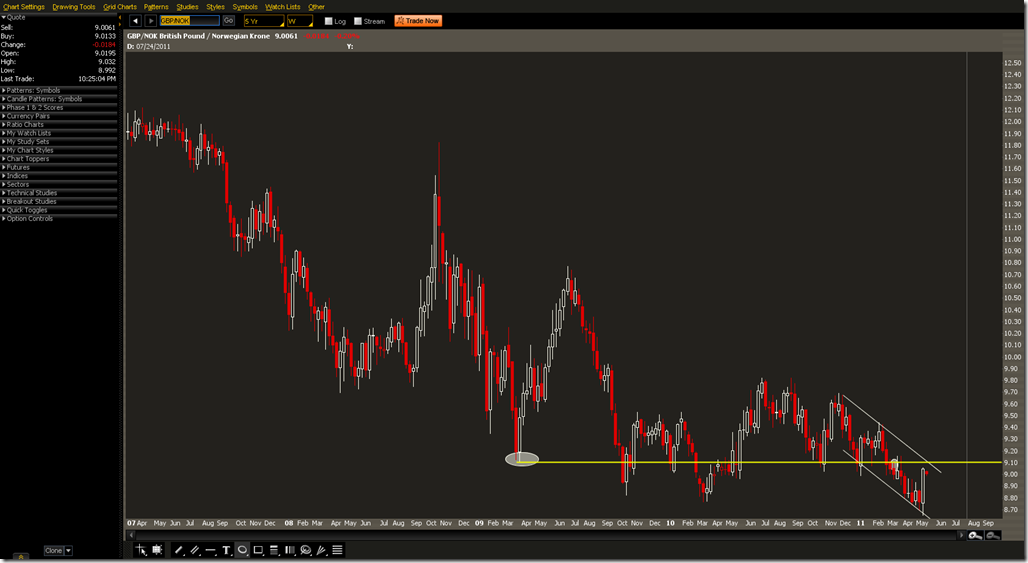
Alternate on the USD/NOK trade since the pattern is similar.  Due to some recent statements by the ECB the USD has been on a tear so there is some risk with    What we’re looking at here is


Sell Limit: GBP/NOK 9.10378
Buy Limit: GBP/NOK 8.80000
Buy Stop: 9.20000

Max Loss: 192.44
Max Gain: 607.56


2011-05-08-GPBNOK-PROPHET


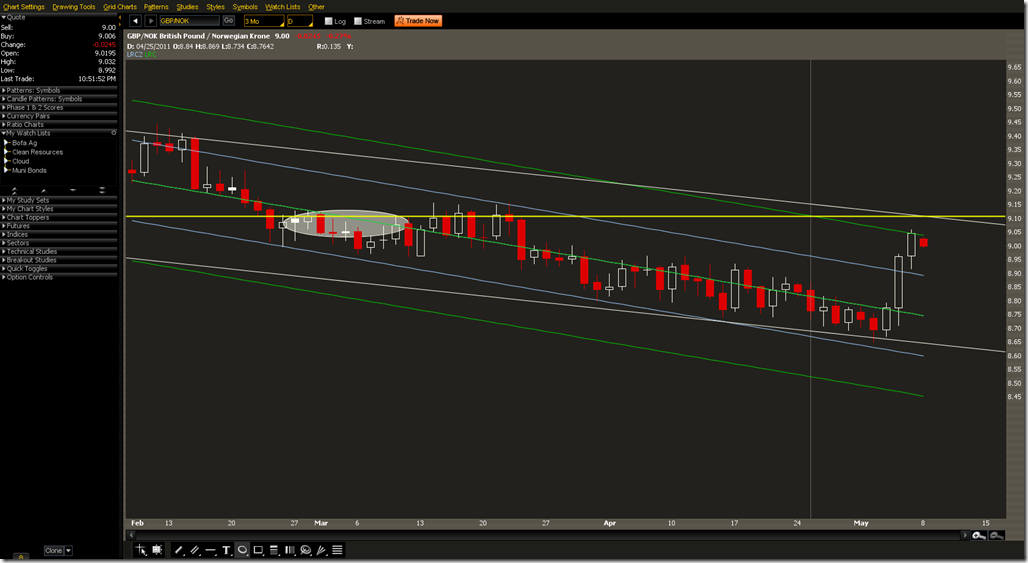
The pair bounced off the Linear Regression Channel also indicating close to this level might be a good interesting.

2011-05-08-GBPNOK-LRC-PROPHET

USDNOK – US Dollar vs. Norwegian Krone Trade


This was one of the trades discussed on Money in Motion.  The idea is that oil will be going up again and rather than using commodities to make money on the move, it’s possible to use currencies.  Since Norway is an oil rich country it is the subject of the trade.  In order to buy oil, foreign countries have to convert their money into that of the seller.  This increases demand for the Norwegian Krone.  The USD has some interesting technicals in relation to the Krone which makes it an complimentary currency to the trade.

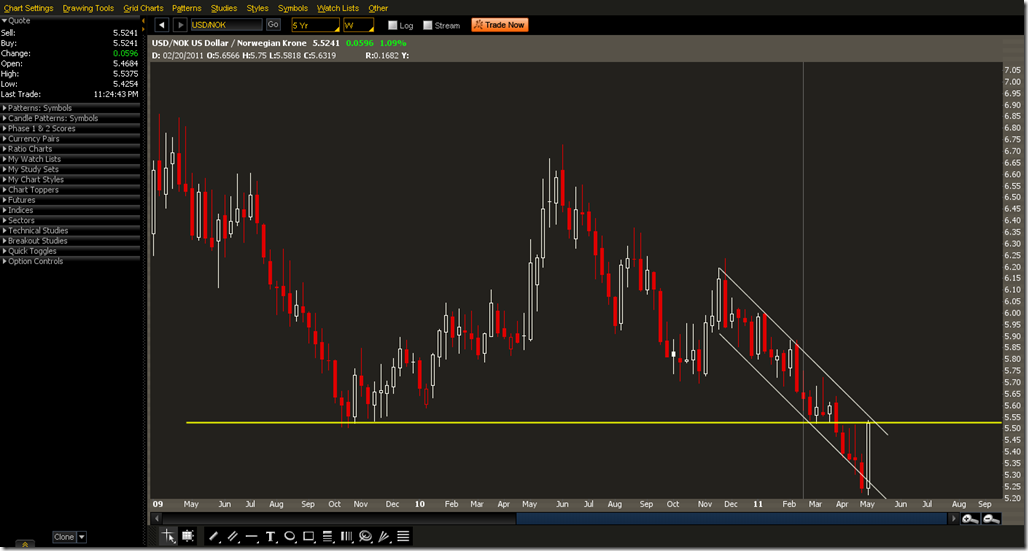
On this weekly chart we can see multiple bottoms in Q4 2009.  Since we’re below that support, it will act as resistance.  The USD/NOK pair is in a channel now.  This week it neared the upper end of the channel which also is at resistance from Q4 2009. 

We would want to wait for a bounce off the trend line and support before shorting the USD and getting long the NOK.  Variations on this entry should be made to accommodate a bounce down.

Sell Limit: USD/NOK 5.55000
Buy Stop: USD/NOK 5.60000
Buy Limit: USD/NOK 5.30000

This gives us roughly $100 of risk per contract with a maximum gain of $500 per contract if we hit 5.30000

2011-05-07-USDNOK-PROPHET

HES –Trade in HESS


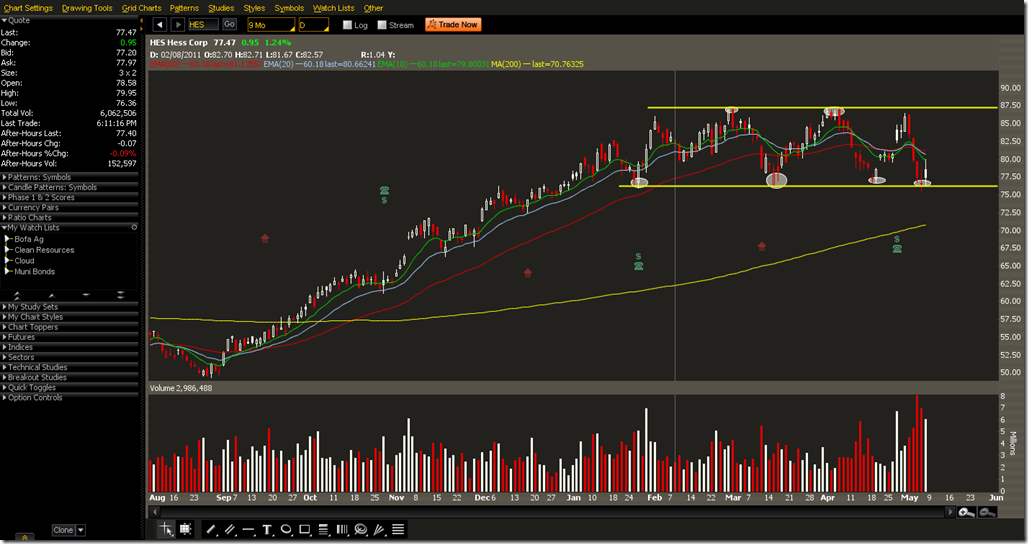
HESS is trading in a range and has bounced off support.  There are multiple bottoms near $75 and multiple tops near $87.50.  One way to play this is through Iron Condors. Optionally, we would want to leg into the call side since ATM Calls are worth more than what we can get right now.

Iron Condor

Sell May 11  75 PUT
Buy May 11 72.5 PUT
CREDIT .59

Sell May 11  87.5 CALL
Buy May 11 90 CALL
CREDIT .09

If we want to get more directional for a debit we could purchase an ATM Call at 77.50. 

Buy May 11 77.5 CALL
DEBIT 2.22

It’s all a matter of style.  The total downside risk for both trades is about the same.  The Call buy has more upside potential from here.


2011-05-06-HES-PROPHET