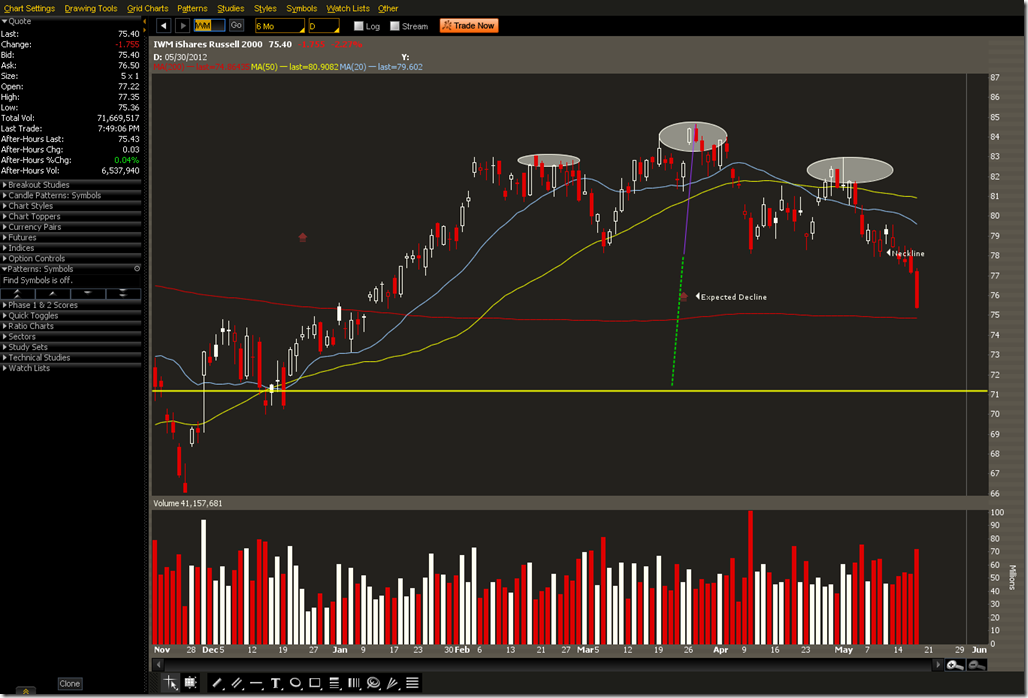
IWM has fallen below the neck line of a head & shoulders pattern. We took action on May 4 to hedge risk by moving into a 76 Put Calendar after seeing the beginning of a H&S pattern. The 20MA was under the 50MA which lead us to believe there would be continued weakness.
This position benefitted from the increase in volatility (RVX) over the past few days. We traded through the max profit point one day before expiration which meant the position worked perfectly. The measured move from the head to the neckline places IWM around the 71 level. There is also some prior support close to there. There could be a small bounce at the 200MA, but if news out of Europe continues to be uncertain this could end up being a textbook H&S pattern.
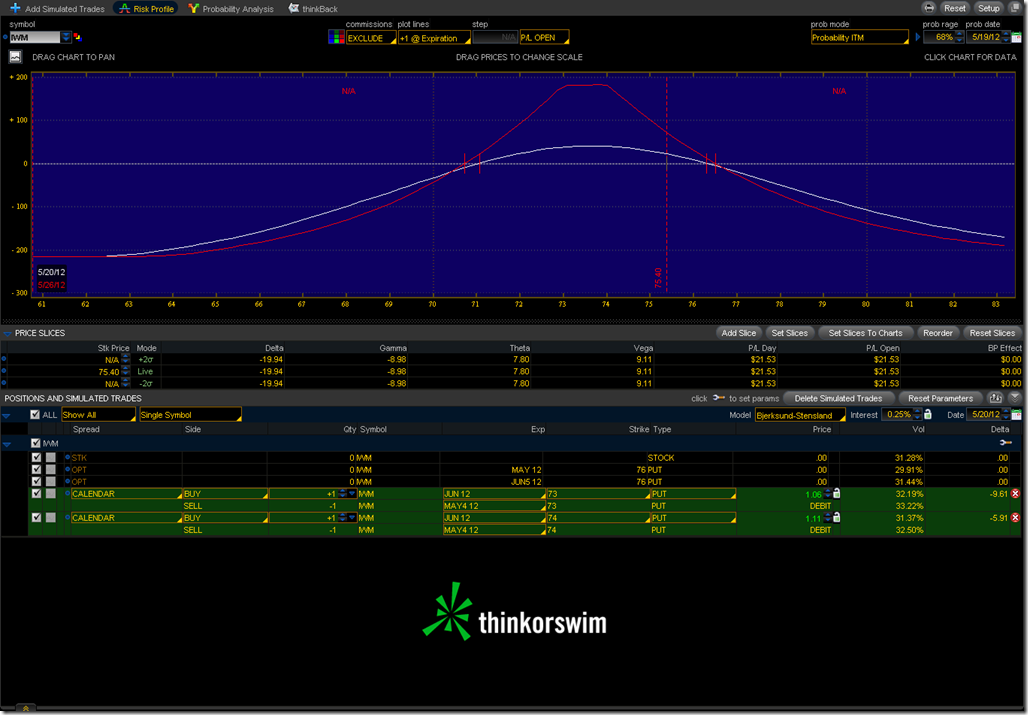
If there is a continued downside move, buying more PUT calendars here could be a good choice. Buying a June PUT and selling a May Weekly PUT against it could offer several opportunities to roll the calendar or switch it to a diagonal. A double calendar gives a large area to salvage the trade in a one week period, but it reduces the reward.
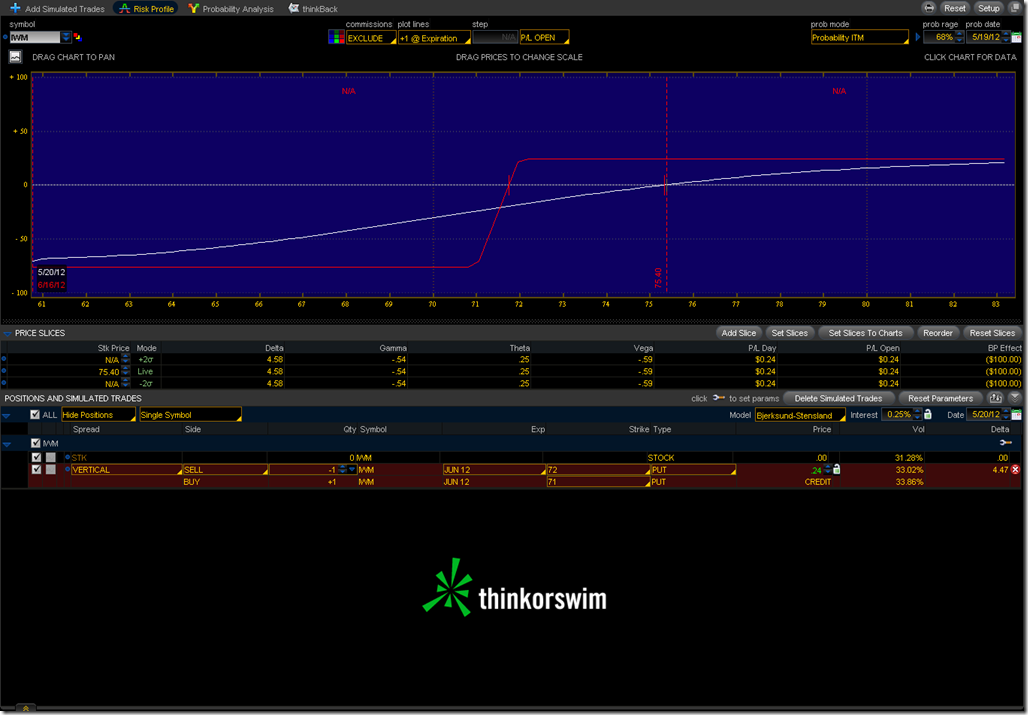
A different strategy would be to sell a 30 Delta PUT Vertical around 72 in anticipation of a bounce. They are currently going for .24, but putting in a limit order to ask for more premium might be in order, especially if there is more downside. .36 would be at roughly 73


