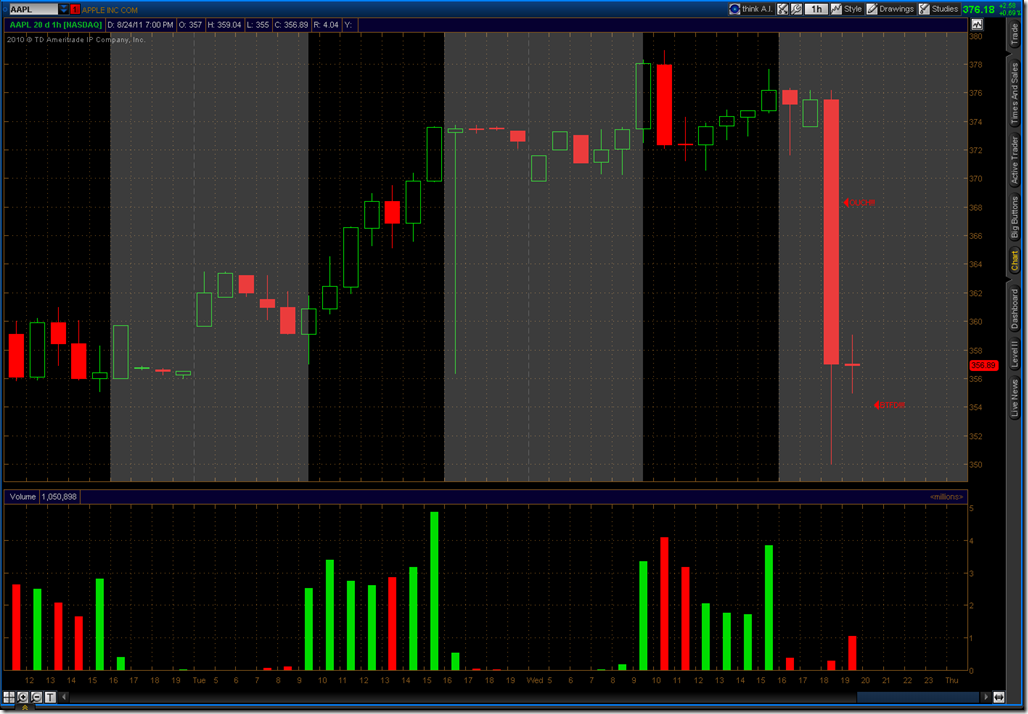
Steve Jobs announced that he is resigning today, sending Apple stock lower. Apple went as low as 350 in the after hours session. This is a pull back but may not be the time to step into the fire.
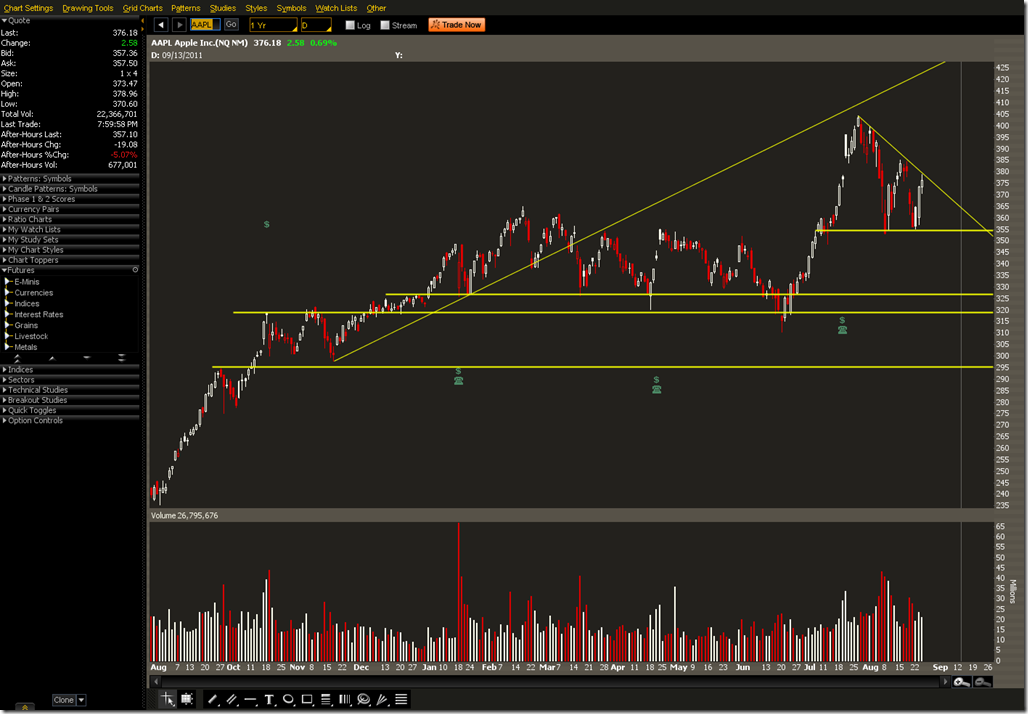
On a daily chart we have several areas to look at. Around 350 is current support in a descending triangle. Since there’s bearish news this could completely break down. Goldman Sachs recommended that their subscribers Sell the January 2012 $300 PUT. This means the seller agrees to take around $11 in premium and agrees to buy the stock for $300 regardless of how low it goes. It’s like being an insurance company. That idea lost 30% today so be glad you didn’t do it. There are support levels around 325/320 and 300/295.
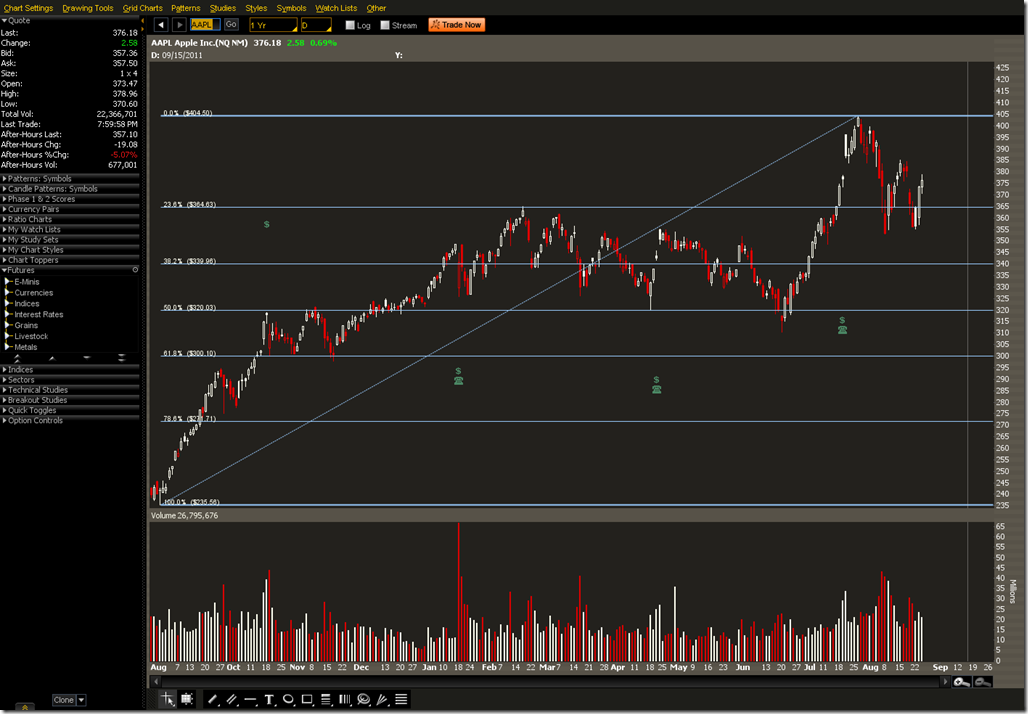
On a one year chart the 320 level corresponds to the 50% Fibonacci level and 300 corresponds to the 61.8% Fibonacci level. 300 seems like a reasonable target. That is about the height of the descending triangle subtracted from its base.
A two standard deviation move from this afternoons close is 291.19. Three standard deviations is 273.44.
The September 290/285 Bull Put Spread could be a reasonable bet to leave a limit order on. Less likely but safer would be the 275/270 Bull Put Spread. The order should be for 25% of the width of the spread, in this case 1.25 minimum.
Order size would need to be according to individual taste and risk. Buying some long puts in QQQ as a hedge with some of the proceeds of making this trade could lessen the pain if the stock plummets past either the second or third standard deviation.


