Unless you’ve been hiding under a rock you know that the PIIGS nations are really hammering Europe. We keep hearing about the collapse of the US Dollar, but is the Euro in more trouble than the dollar? Now that QE2 is off the table that might be changing. The S&P 500 has had a hard time breaking above its recent channel and has been going sideways for a few days now. How can we take advantage of the situation?
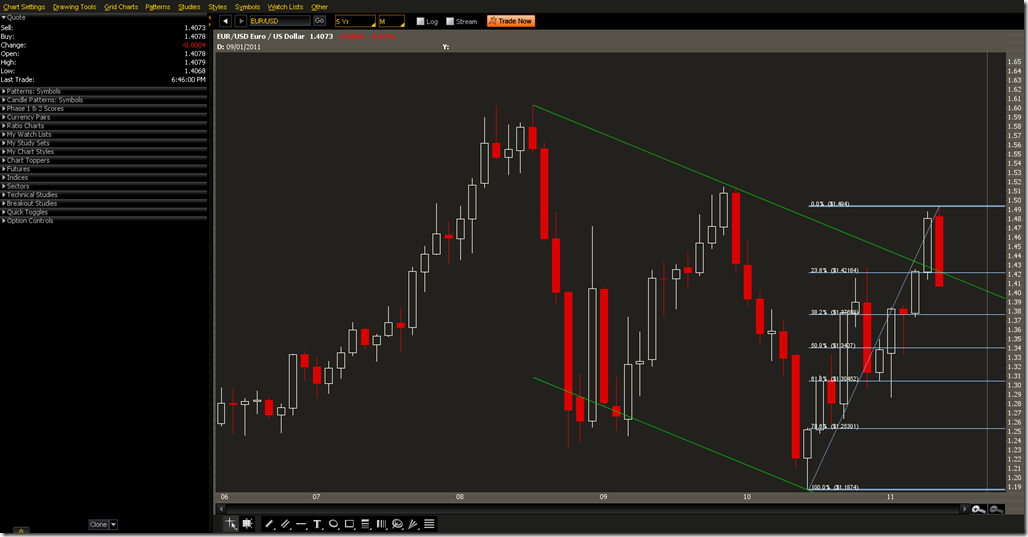
A monthly chart will let us visualize what is happening here. Last month EUR/USD made it above the down channel, but it returned back to the channel this month. There are several interesting things happening here. The channel intersects with the 23.6% Fibonacci level this month and the underlying broke down. This month’s candle is also a bearish engulfing candle. On a weekly chart EUR/USD topped out on 4/24, then formed a bearish engulfing candle the following week and has a confirmation candle the week after. Last week’s candle was also the first weekly close inside the trend line and below the 23.6% Fibonacci level.
Shorting EUR/USD around 1.4150 with a 100-150 pip stop to begin with would be a good entry strategy. The target price to cover would be close to 1.3800 at the next Fibonacci level. This trade is worth $350 per contract with 100-150 worth of risk depending on where the stop order is placed.
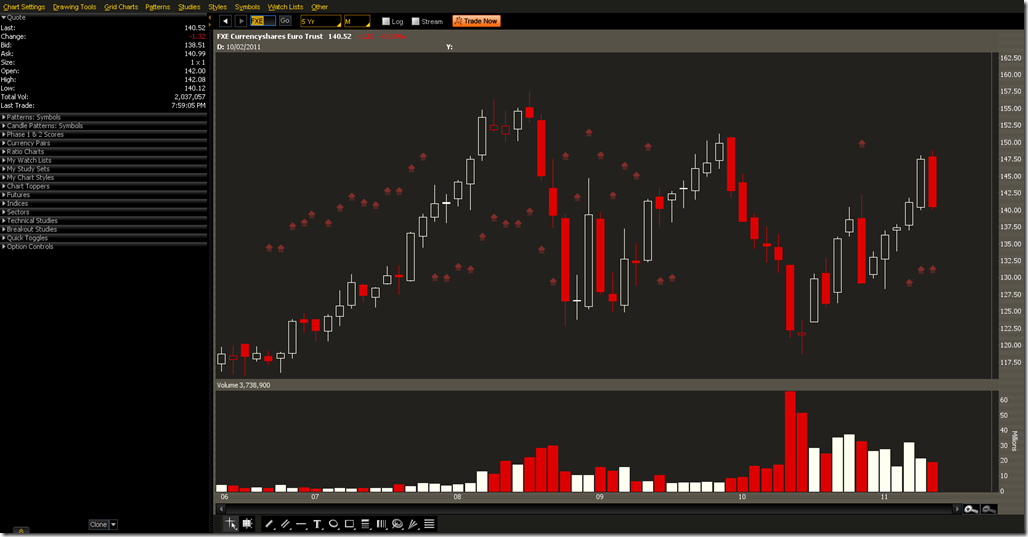
If you don’t have access to FX trading, then a similar play can be done using ETFs and Options. FXE is the Euro ETF. Notice that the candles are similar to EUR/USD. It doesn’t track perfectly so keep that in mind. Shorting the ETF directly would require a lot of collateral. It’s possible to do, but you would tie up a lot of capital.
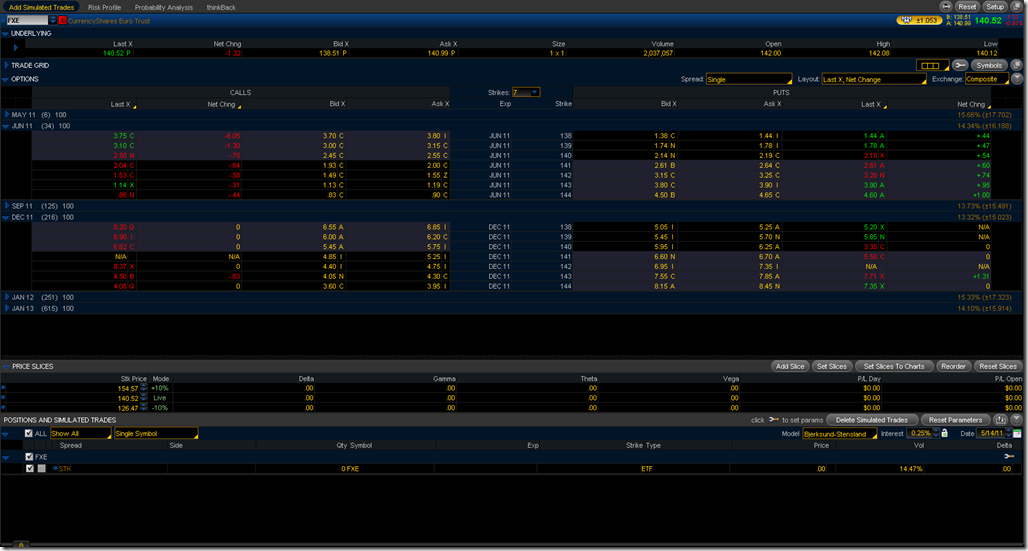
A short term play with options would be to assemble an ATM long Put. The June 140/138 Put can be bought for $76 per contract. Which would allow for us to reach maximum profit if FXE reaches 138. The net max profit for this trade would be 200-76 = 124 per contract.
A longer term strategy could be to buy the 138 strike Put and begin selling/rolling the June/September 138 strike. There is potential for this to drop to 134 or 130 which correspond to the 50% and 61.8% Fibonacci retracement respectively.


