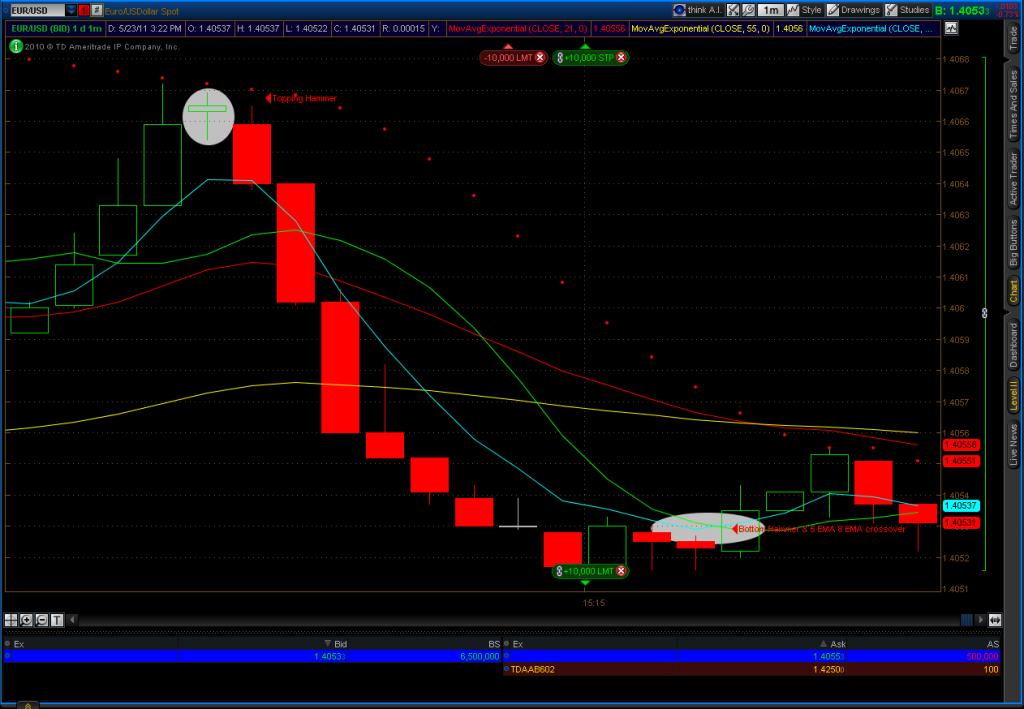
Some friends have asked some trading techniques we use. Here we are trading the Euro vs the US Dollar (EURUSD). The technique can be found in the book FX Bootcamp’s Guide to Strategic and Tactical FOREX Trading. I recommend the book if you plan on trading FX and the technique can also work with Futures and Equities. Basically we setup a chart with four moving averages. They are:
- 5 EMA
- 8 SMA
- 21 EMA
- 55 EMA
To over simplify When the 21 line is above the 55 line things are very bullish. The opposite holds true when the 21 line is below the 55 line. The 5 and the 8 are used for short term confirmation. There may be pullbacks on the 5/8 period if the 21 line is above the 55 line, but they may reverse quickly.
We also added the ParabolicSAR study to help set initial stop loss orders. The ParabolicSAR dots are above the bars on the chart when things are in a bearish trend and below the bars when the trend turns bullish. For this trade we are using four different moving averages and ParabolicSAR as a confirming indicator.
When observing the chart we observed a short uptrend. The fourth candle did not cross the ParabolicSAR marker, indicating that the currency pair had not experienced a strong reversal. The next candle is an Evening Star and still did not cross the ParabolicSAR. The following candle turned bearish giving us a good indication that the trend would continue. Near the bottom of the trend there were two Hammer candles in a row followed by a green candle. The 5 EMA crossed above the 8 SMA around the same time. That was an indication to exit the short position. We were able to ride this trade from 1.4064 down to 1.4053. That is 11 pips between the two. On 10 contracts that would be roughly $110 in gains over a roughly 11 minute timeframe. We did this on a 1 minute chart which can be very bumpy and result in a lot of false signals that have bumped us out of the trade. By adding ParabolicSAR we and learning the various candle shapes and patterns we were able to pick an entry using the rollercoaster 1 minute chart. Most traders tend to do fine using the 5, 15, or 30 minute chart for short to medium ranges.
This provides a high level overview. Nothing can substitute for education and practice. There are many techniques that work in different situations. Combining what works for the individual trader is always the best approach. This should also serve as a warning to anyone who tries to trade without putting in the time to learn winning techniques before trading with real money.
